OPEN-SOURCE SCRIPT
Atualizado BTC Power of Law x Central Bank Liquidity
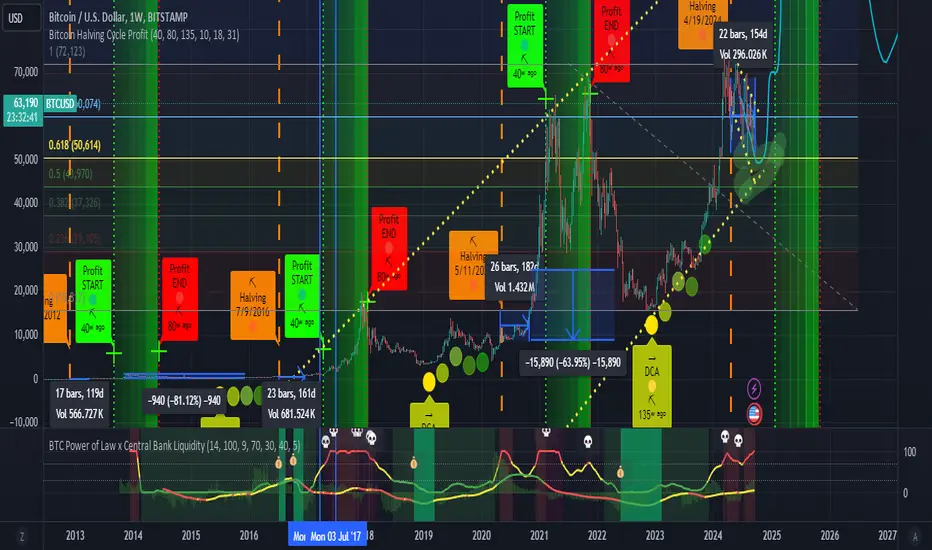
This indicator combines Bitcoin's long-term growth model (Power Law) with global central bank liquidity to help identify potential buy and sell signals.
How it works:
Power Law Oscillator: This part of the indicator tracks how far Bitcoin's current price is from its expected long-term growth, based on an exponential model. It helps you see when Bitcoin may be overbought (too expensive) or oversold (cheap) compared to its historical trend.
Central Bank Liquidity: This measures the amount of money injected into the financial system by major central banks (like the Fed or ECB). When more money is printed, asset prices, including Bitcoin, tend to rise. When liquidity dries up, prices often fall.
By combining these two factors, the indicator gives you a more accurate view of Bitcoin's price trends.
How to interpret:
Green Line: Bitcoin is undervalued compared to its long-term growth, and the liquidity environment is supportive. This is typically a buy signal.
Yellow Line: Bitcoin is trading near its expected value, or there's uncertainty due to mixed liquidity conditions. This is a hold signal.
Red Line: Bitcoin is overvalued, or liquidity is tightening. This is a potential sell signal.
Zones:
The background will turn green when Bitcoin is in a buy zone and red when it's in a sell zone, giving you easy-to-read visual cues.
Notas de Lançamento
Now with central bank money supply histogramNotas de Lançamento
Added some emoji for better visualizationNotas de Lançamento
Fixed bug with emojisNotas de Lançamento
Clearer high prob buy zonesScript de código aberto
Em verdadeiro espírito do TradingView, o criador deste script o tornou de código aberto, para que os traders possam revisar e verificar sua funcionalidade. Parabéns ao autor! Embora você possa usá-lo gratuitamente, lembre-se de que a republicação do código está sujeita às nossas Regras da Casa.
Aviso legal
As informações e publicações não se destinam a ser, e não constituem, conselhos ou recomendações financeiras, de investimento, comerciais ou de outro tipo fornecidos ou endossados pela TradingView. Leia mais nos Termos de Uso.
Script de código aberto
Em verdadeiro espírito do TradingView, o criador deste script o tornou de código aberto, para que os traders possam revisar e verificar sua funcionalidade. Parabéns ao autor! Embora você possa usá-lo gratuitamente, lembre-se de que a republicação do código está sujeita às nossas Regras da Casa.
Aviso legal
As informações e publicações não se destinam a ser, e não constituem, conselhos ou recomendações financeiras, de investimento, comerciais ou de outro tipo fornecidos ou endossados pela TradingView. Leia mais nos Termos de Uso.