PROTECTED SOURCE SCRIPT
Atualizado Ultimate Average 3.0
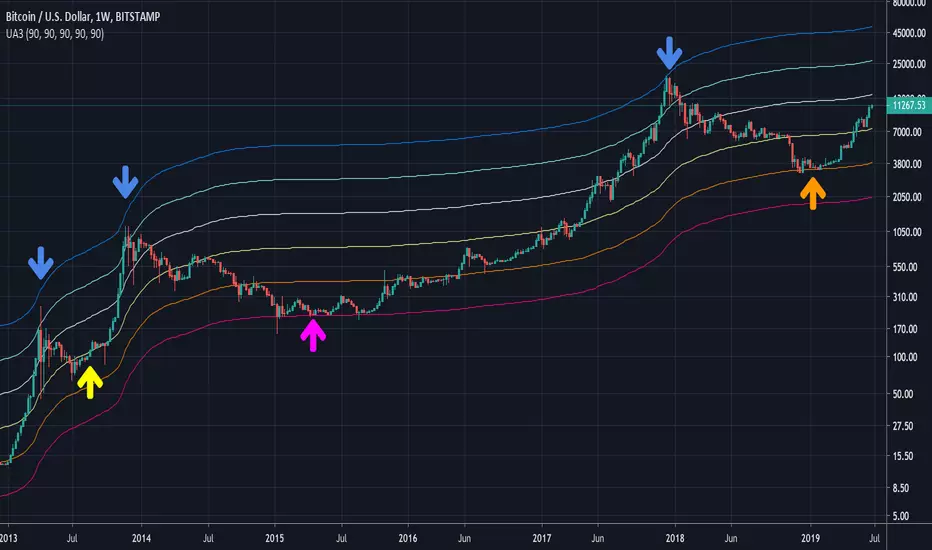
Purple = Actual average price over total timeframe.
Other lines are factors above the actual average.
A pattern emerges where the purple is hit, then a parabolic rise to the blue top, then the a drawback down to the orange, then parabolic, then drawback to yellow, then parabolic to blue, then a reset back to the purple line.
Other lines are factors above the actual average.
A pattern emerges where the purple is hit, then a parabolic rise to the blue top, then the a drawback down to the orange, then parabolic, then drawback to yellow, then parabolic to blue, then a reset back to the purple line.
Notas de Lançamento
updates timescale automationScript protegido
Esse script é publicada como código fechado. No entanto, você pode gerenciar suas escolhas de bate-papo. Por favor, abra suas Configurações do perfil
Aviso legal
As informações e publicações não se destinam a ser, e não constituem, conselhos ou recomendações financeiras, de investimento, comerciais ou de outro tipo fornecidos ou endossados pela TradingView. Leia mais nos Termos de Uso.
Script protegido
Esse script é publicada como código fechado. No entanto, você pode gerenciar suas escolhas de bate-papo. Por favor, abra suas Configurações do perfil
Aviso legal
As informações e publicações não se destinam a ser, e não constituem, conselhos ou recomendações financeiras, de investimento, comerciais ou de outro tipo fornecidos ou endossados pela TradingView. Leia mais nos Termos de Uso.