OPEN-SOURCE SCRIPT
Sri Yantra-Scret Geometry - AYNET
Explanation of the Script
Inputs:
periods: Number of bars used for calculating the moving average and standard deviation.
yloc: Chooses the display location (above or below the bars).
Moving Average and Standard Deviation:
ma: Moving average of the close price for the specified period.
std: Standard deviation, used to set the range for the Sri Yantra triangle points.
Triangle Points:
p1, p2, and p3 are the points for constructing the triangle, with p1 and p2 set at two standard deviations above and below the moving average, and p3 at the moving average itself.
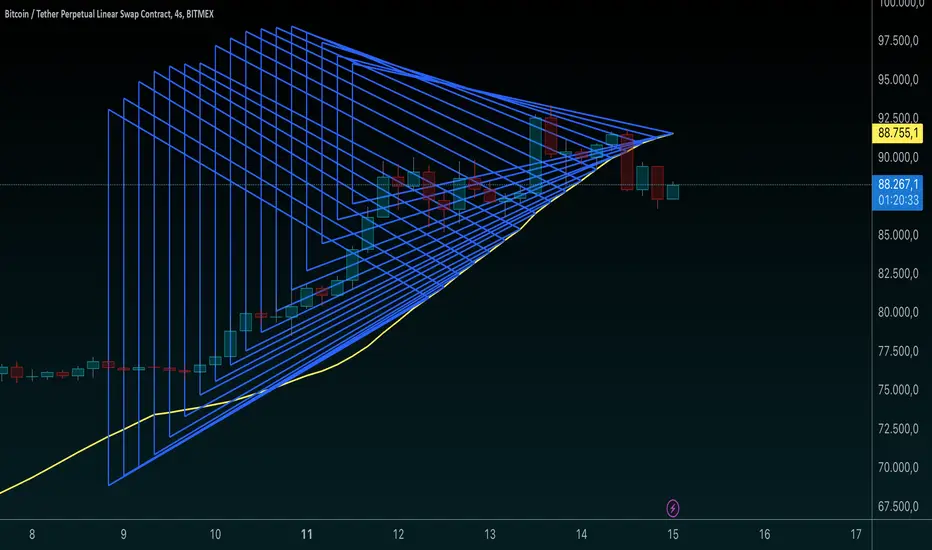
Sri Yantra Triangle Drawing:
Three lines form a triangle, with the moving average line serving as the midpoint anchor.
The triangle pattern shifts across bars as new moving average values are calculated.
Moving Average Plot:
The moving average is plotted in red for visual reference against the triangle pattern.
This basic script emulates the Sri Yantra pattern using price data, creating a spiritual and aesthetic overlay on price charts, ideal for users looking to incorporate sacred geometry into their technical analysis.
Inputs:
periods: Number of bars used for calculating the moving average and standard deviation.
yloc: Chooses the display location (above or below the bars).
Moving Average and Standard Deviation:
ma: Moving average of the close price for the specified period.
std: Standard deviation, used to set the range for the Sri Yantra triangle points.
Triangle Points:
p1, p2, and p3 are the points for constructing the triangle, with p1 and p2 set at two standard deviations above and below the moving average, and p3 at the moving average itself.
Sri Yantra Triangle Drawing:
Three lines form a triangle, with the moving average line serving as the midpoint anchor.
The triangle pattern shifts across bars as new moving average values are calculated.
Moving Average Plot:
The moving average is plotted in red for visual reference against the triangle pattern.
This basic script emulates the Sri Yantra pattern using price data, creating a spiritual and aesthetic overlay on price charts, ideal for users looking to incorporate sacred geometry into their technical analysis.
Script de código aberto
Em verdadeiro espírito do TradingView, o criador deste script o tornou de código aberto, para que os traders possam revisar e verificar sua funcionalidade. Parabéns ao autor! Embora você possa usá-lo gratuitamente, lembre-se de que a republicação do código está sujeita às nossas Regras da Casa.
Aviso legal
As informações e publicações não se destinam a ser, e não constituem, conselhos ou recomendações financeiras, de investimento, comerciais ou de outro tipo fornecidos ou endossados pela TradingView. Leia mais nos Termos de Uso.