PROTECTED SOURCE SCRIPT
GTO

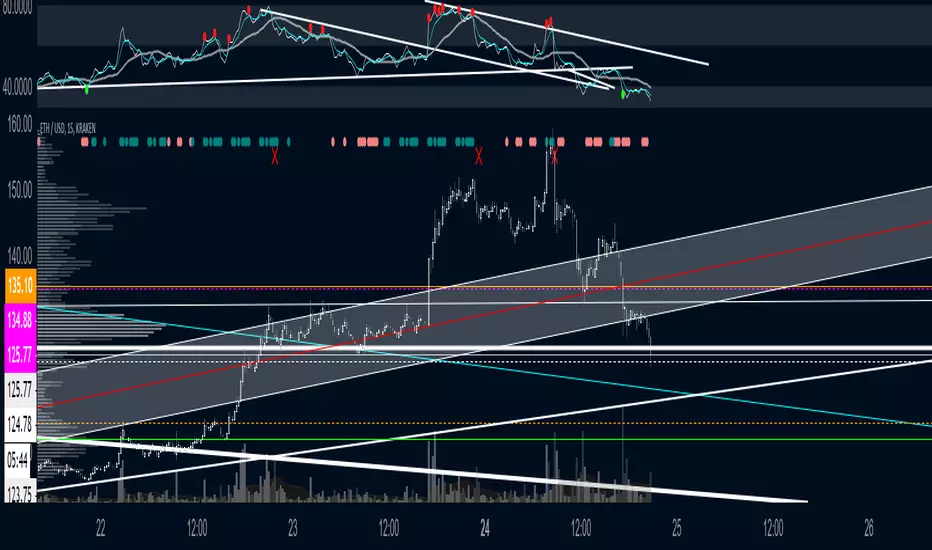
GTO is a easy to understand and use script
it just uses candle closes and other variables to gauge momentum that is then plotted on top of the chart
teal = bullish
salmon = bearish
you want them plotting while in your desired trade, if you are long and bearishness starts showing may be good toexit vise versa
Red X is BULL fatigue or can other wise be seen as bearish
Green X is the opposite
@satoshiiheavy
Technical Analyst for cryptcurrentlyvip.com
Script protegido
Esse script é publicada como código fechado. No entanto, você pode gerenciar suas escolhas de bate-papo. Por favor, abra suas Configurações do perfil
Have a plan. Trade it!
Aviso legal
As informações e publicações não se destinam a ser, e não constituem, conselhos ou recomendações financeiras, de investimento, comerciais ou de outro tipo fornecidos ou endossados pela TradingView. Leia mais nos Termos de Uso.