PROTECTED SOURCE SCRIPT
Bitcoin long term trends
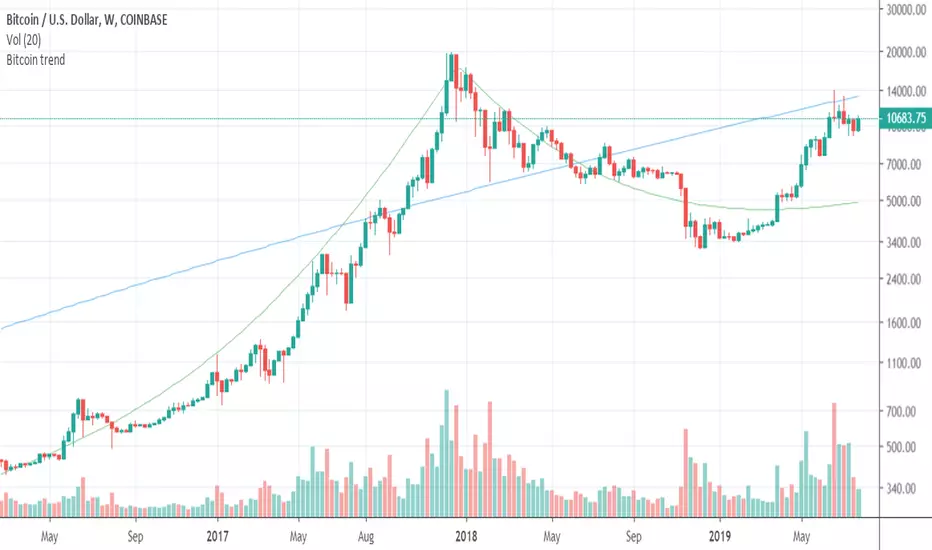
This script shows the long term trends in Bitcoin price.
It is based on my mathematical formula for the long term trends.
The blue line is a long term trend as a power function B = (t/693)^5.526
And the green line is a more sophisticated trend, which models the wave behavior over the whole history of bitcoin.
This script is only applicable to BTCUSD price. The trend lines are calculated as the functions of time only.
 BTCUSD
It is based on my mathematical formula for the long term trends.
The blue line is a long term trend as a power function B = (t/693)^5.526
And the green line is a more sophisticated trend, which models the wave behavior over the whole history of bitcoin.
This script is only applicable to BTCUSD price. The trend lines are calculated as the functions of time only.
Script protegido
Esse script é publicada como código fechado. No entanto, você pode usar ele livremente e sem nenhuma limitação – saiba mais aqui.
Aviso legal
As informações e publicações não devem ser e não constituem conselhos ou recomendações financeiras, de investimento, de negociação ou de qualquer outro tipo, fornecidas ou endossadas pela TradingView. Leia mais em Termos de uso.