OPEN-SOURCE SCRIPT
Crypto Dominator Visualiser
1. What is it and why is it useful?
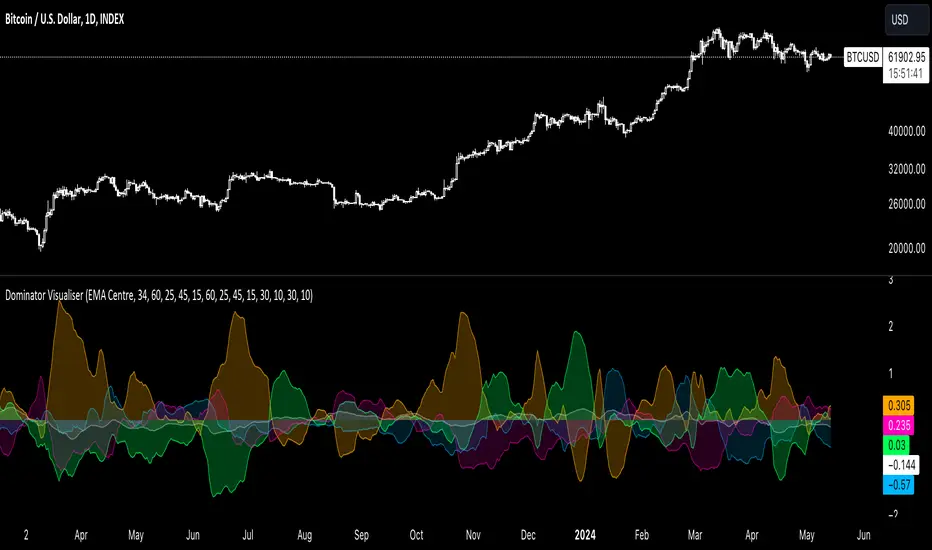
The Dominator Visualiser indicator offers traders and investors a comprehensive approach to analyzing marketcap dominance indexes within the cryptocurrency space, presenting them as basic oscillators rather than standard percentage values. This unique representation enables simultaneous observation of multiple indexes in a single pane, providing a holistic view of their relative changes and the flow of capital within the overall crypto market.
2. How does it work?
As a guiding principle, when a plot is positioned above zero, it signifies an ascent in dominance, indicating an influx of capital towards the respective cryptocurrency. Conversely, when below zero, it suggests a decline in dominance, signaling a potential shift of capital away from that particular cryptocurrency. During calmer periods, all plots tend to hover close to zero. Moreover, basic overbought/oversold conditions can be inferred from these oscillators, offering insights into potential market reversals.
The default setup includes:
1. Bitcoin (Orange): BTC.D
BTC.D
2. Ethereum (Blue): ETH.D
ETH.D
3. Stablecoins (Pink): USDT.D +
  USDC.D
4. Altcoins (Green): 100 - (all of the above)
Each index is represented with customizable colors and opacity settings to suit individual's preferences.
In addition to the default indexes, users have the option to activate other indicators to further expand their analytical scope:
5. Total DeFi (White): TOTALDEFI.D
6. Current Symbol: whenever available
The included presets offer various oscillator types, each designed for simplicity and ease of interpretation:
1. EMA Centre
2. SMA Centre
3. Median Centre
4. Midrange Centre
These presets calculate the difference between the actual value and its respective average, with EMA being the default choice. Users preferring SMA or other moving averages can select their preferred option accordingly.
Furthermore, momentum indicators such as Simple Delta, Weighted Delta, and Running Delta are available:
1. Simple Delta: Calculates the difference between the current value and the value a certain number of bars prior.
2. Weighted Delta: Similar to Simple Delta but uses a weighted moving average for calculation.
3. Running Delta: Similar to Weighted Delta but utilizes a running moving average.
RSI and CMO presets are also provided:
1. RSI: Relative Strength Index, centered around 0 without the x100 multiplication factor.
2. CMO: Chande Momentum Oscillator, a simplified version of RSI based on simple delta.
3. Summary and Examples
In short, the Dominator Visualiser offers traders and investors a practical visual aid to their analysis of cryptocurrency marketcap dominance indexes by representing them as basic oscillators. With customizable settings, multiple oscillator presets, and supplementary indicators, this indicator provides a sophisticated yet user-friendly tool for cryptocurrency analysis, empowering investors and traders with actionable insights for navigating the dynamic cryptocurrency market landscape.
The following are some case studies.


The Dominator Visualiser indicator offers traders and investors a comprehensive approach to analyzing marketcap dominance indexes within the cryptocurrency space, presenting them as basic oscillators rather than standard percentage values. This unique representation enables simultaneous observation of multiple indexes in a single pane, providing a holistic view of their relative changes and the flow of capital within the overall crypto market.
2. How does it work?
As a guiding principle, when a plot is positioned above zero, it signifies an ascent in dominance, indicating an influx of capital towards the respective cryptocurrency. Conversely, when below zero, it suggests a decline in dominance, signaling a potential shift of capital away from that particular cryptocurrency. During calmer periods, all plots tend to hover close to zero. Moreover, basic overbought/oversold conditions can be inferred from these oscillators, offering insights into potential market reversals.
The default setup includes:
1. Bitcoin (Orange):
2. Ethereum (Blue):
3. Stablecoins (Pink):
4. Altcoins (Green): 100 - (all of the above)
Each index is represented with customizable colors and opacity settings to suit individual's preferences.
In addition to the default indexes, users have the option to activate other indicators to further expand their analytical scope:
5. Total DeFi (White):
6. Current Symbol: whenever available
The included presets offer various oscillator types, each designed for simplicity and ease of interpretation:
1. EMA Centre
2. SMA Centre
3. Median Centre
4. Midrange Centre
These presets calculate the difference between the actual value and its respective average, with EMA being the default choice. Users preferring SMA or other moving averages can select their preferred option accordingly.
Furthermore, momentum indicators such as Simple Delta, Weighted Delta, and Running Delta are available:
1. Simple Delta: Calculates the difference between the current value and the value a certain number of bars prior.
2. Weighted Delta: Similar to Simple Delta but uses a weighted moving average for calculation.
3. Running Delta: Similar to Weighted Delta but utilizes a running moving average.
RSI and CMO presets are also provided:
1. RSI: Relative Strength Index, centered around 0 without the x100 multiplication factor.
2. CMO: Chande Momentum Oscillator, a simplified version of RSI based on simple delta.
3. Summary and Examples
In short, the Dominator Visualiser offers traders and investors a practical visual aid to their analysis of cryptocurrency marketcap dominance indexes by representing them as basic oscillators. With customizable settings, multiple oscillator presets, and supplementary indicators, this indicator provides a sophisticated yet user-friendly tool for cryptocurrency analysis, empowering investors and traders with actionable insights for navigating the dynamic cryptocurrency market landscape.
The following are some case studies.
Script de código aberto
Em verdadeiro espírito do TradingView, o criador deste script o tornou de código aberto, para que os traders possam revisar e verificar sua funcionalidade. Parabéns ao autor! Embora você possa usá-lo gratuitamente, lembre-se de que a republicação do código está sujeita às nossas Regras da Casa.
🎁🎄 Christmas SALE 50% Off with code XMAS50 (ends Dec 28) at whop.com/quantalgo/
📩 DM if you need any custom-built indicators or strategies.
📩 DM if you need any custom-built indicators or strategies.
Aviso legal
As informações e publicações não se destinam a ser, e não constituem, conselhos ou recomendações financeiras, de investimento, comerciais ou de outro tipo fornecidos ou endossados pela TradingView. Leia mais nos Termos de Uso.