OPEN-SOURCE SCRIPT
Expected Daily Range @shrilss
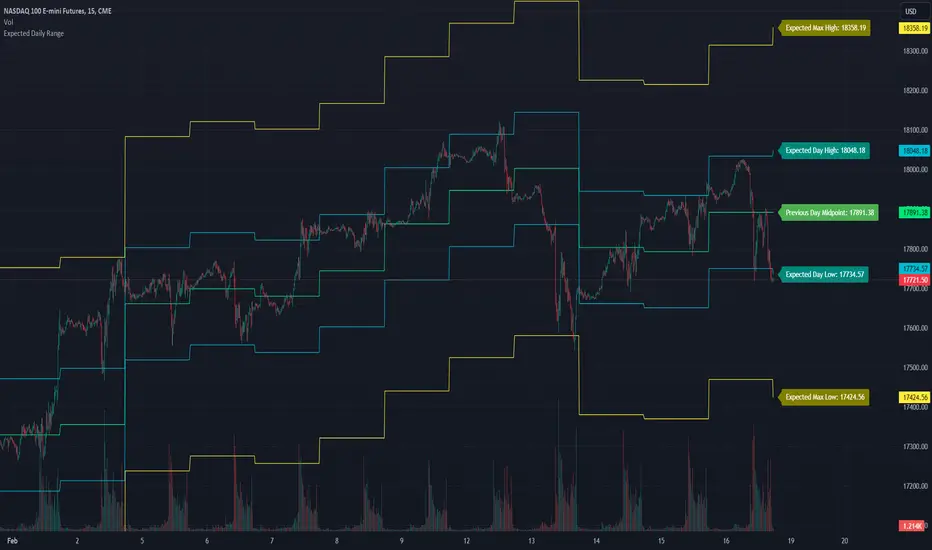
This indicator provides traders with insights into potential price movements based on statistical analysis of historical data. It calculates expected high and low price levels for the current trading day, as well as maximum expected high and low levels, aiding traders in setting appropriate entry and exit points.
This indicator utilizes the previous day's open and close prices to establish a midpoint, around which the expected price range is calculated. By factoring in a user-defined standard deviation multiplier, traders can adjust the sensitivity of the expected price levels to market volatility.
The script plots the previous day's midpoint, along with the expected high and low price levels for the current day. Additionally, it offers insights into potential maximum price fluctuations by plotting the maximum expected high and low levels.
Script de código aberto
Em verdadeiro espírito do TradingView, o criador deste script o tornou de código aberto, para que os traders possam revisar e verificar sua funcionalidade. Parabéns ao autor! Embora você possa usá-lo gratuitamente, lembre-se de que a republicação do código está sujeita às nossas Regras da Casa.
Aviso legal
As informações e publicações não se destinam a ser, e não constituem, conselhos ou recomendações financeiras, de investimento, comerciais ou de outro tipo fornecidos ou endossados pela TradingView. Leia mais nos Termos de Uso.