PROTECTED SOURCE SCRIPT
Tweak Strat FTFC
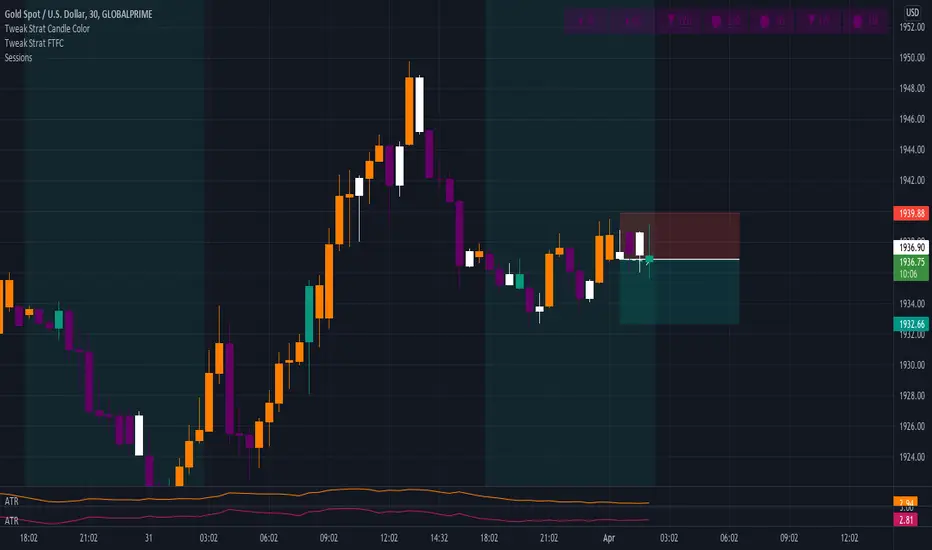
This script allows traders to view timeframe continuity on 7 timeframes at the top of the chart.
The trader selects 7 different timeframes, and the script will reflect whether the current candle for each timeframe is bullish or bearish (current price > the open OR current price < the open).
If a timeframe is currently bearish, the box will be purple.
If a timeframe is currently bullish, the box will be orange.
A circle in the middle of the box indicates that that timeframe is currently an inside bar (1).
An upward arrow indicates that that timeframe is currently a directional up bar (2u).
A downward arrow indicates that that timeframe is currently a directional down bar (2d).
A rectangle indicates that that timeframe is currently an outside bar (3).
NOTE: The color of the boxes is fixed. Traders MUST select a timeframe for EACH OF THE 7 FIELDS.
Script protegido
Esse script é publicada como código fechado. No entanto, você pode gerenciar suas escolhas de bate-papo. Por favor, abra suas Configurações do perfil
Aviso legal
As informações e publicações não se destinam a ser, e não constituem, conselhos ou recomendações financeiras, de investimento, comerciais ou de outro tipo fornecidos ou endossados pela TradingView. Leia mais nos Termos de Uso.