OPEN-SOURCE SCRIPT
Liquidity Heatmap & Volume-Weighted RSI
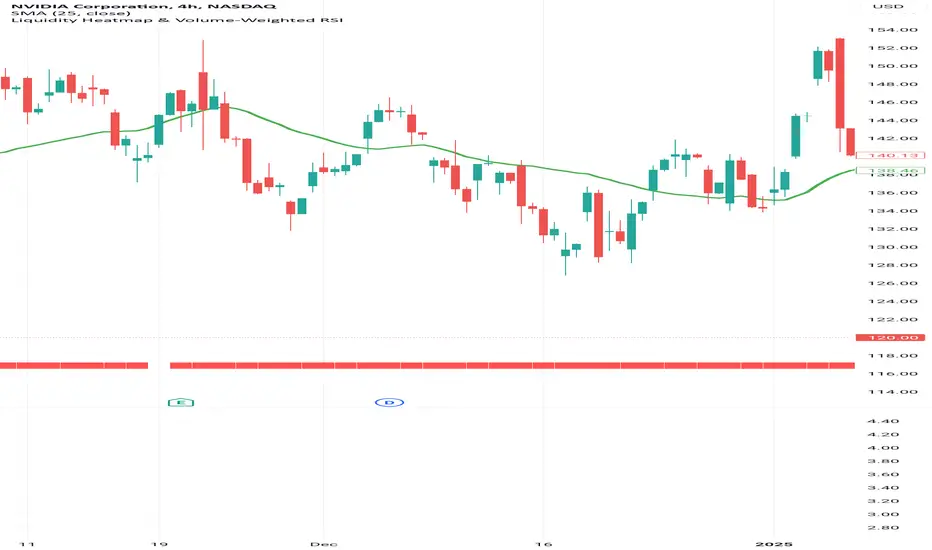
Liquidity Heatmap Indicator with Volume-Weighted RSI
Description:
The Liquidity Heatmap Indicator with Volume-Weighted RSI (VW-RSI) is a powerful tool designed for traders to visualize market liquidity zones while integrating a volume-adjusted momentum oscillator. This indicator provides a dynamic heatmap of liquidity levels across various price points and enhances traditional RSI by incorporating volume weight, making it more responsive to market activity.
Key Features:
Liquidity Heatmap Visualization: Identifies high-liquidity price zones, allowing traders to spot potential areas of support, resistance, and accumulation.
Volume-Weighted RSI (VW-RSI): Enhances the RSI by factoring in trading volume, reducing false signals and improving trend confirmation.
Customizable Sensitivity: Users can adjust parameters to fine-tune heatmap intensity and RSI smoothing.
Dynamic Market Insights: Helps identify potential price reversals and trend strength by combining liquidity depth with momentum analysis.
How to Use:
1. Identify Liquidity Zones: The heatmap colors indicate areas of high and low liquidity, helping traders pinpoint key price action areas.
2. Use VW-RSI for Confirmation: When VW-RSI diverges from price near a liquidity cluster, it signals a potential reversal or continuation.
3. Adjust Parameters: Fine-tune the RSI period, volume weighting, and heatmap sensitivity to align with different trading strategies.
This indicator is ideal for traders who rely on order flow analysis, volume-based momentum strategies, and liquidity-driven trading techniques.
Script de código aberto
Em verdadeiro espírito do TradingView, o criador deste script o tornou de código aberto, para que os traders possam revisar e verificar sua funcionalidade. Parabéns ao autor! Embora você possa usá-lo gratuitamente, lembre-se de que a republicação do código está sujeita às nossas Regras da Casa.
Aviso legal
As informações e publicações não se destinam a ser, e não constituem, conselhos ou recomendações financeiras, de investimento, comerciais ou de outro tipo fornecidos ou endossados pela TradingView. Leia mais nos Termos de Uso.