OPEN-SOURCE SCRIPT
Atualizado Simple Portfolio Tracker

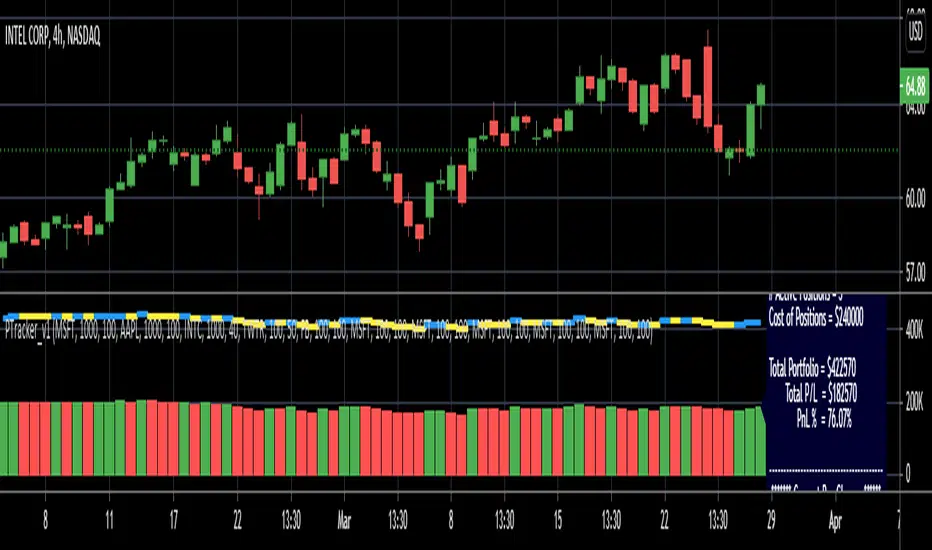
This is just a simple portfolio tracker that i started to play around with - i'm sure there are smarter ways to do this, but i chose the simpler way :) -- please feel free to use this, or consider it as a starting point to your own indicator.
i will come back later and add some more stuff once i get time. for example, show the total value, recent change, P&L % ..etc
So the simple idea is to track a portfolio of few positions and watch how the total portfolio and the PnL changes over time as the price of the individual holdings move up and down. it can be added to any chart.
The code is currently set to track 5 positions - settings allow to enter if the positions is used or not, symbol, amount and cost price..
** note: more positions can be added by editing the code and copying and pasting the marked "position block" that contains the input statements and the calculations, then changing/replacing the position identifier (_1, _2, ..etc) in all variables with new number..
--- don't forget to add these extra positions you insert in the code to the formula lines that calculate the totals
i tried to make this as easy as possible in the code. the code includes a sample portfolio as default values just to help "demo" how this works
the input is made easy, thanks to the recent addition of the "inline" feature in the input() statement
i don't know if some traders will find this useful ?? or if more about how to use it is needed.. let me know in the comments.. as i mentioned, i was just playing with the idea over the weekend so didn't really put a lot of work into it.
Credits and thanks to boji1 for inspiring this :)
Notas de Lançamento
- Support up to 10 positions per portfolio- added the Summary (info) box with key portfolio stats all up and for current bar based on the chart timeframe
- some other code clean-ups
Next
- i'd like to include a way to add some "free cash". most position traders will always keep free cash in the account
- change the code to use arrays - will make things a lot easier and cleaner
- refine the infobox and add some more portfolio stats
Script de código aberto
Em verdadeiro espírito do TradingView, o criador deste script o tornou de código aberto, para que os traders possam revisar e verificar sua funcionalidade. Parabéns ao autor! Embora você possa usá-lo gratuitamente, lembre-se de que a republicação do código está sujeita às nossas Regras da Casa.
Aviso legal
As informações e publicações não se destinam a ser, e não constituem, conselhos ou recomendações financeiras, de investimento, comerciais ou de outro tipo fornecidos ou endossados pela TradingView. Leia mais nos Termos de Uso.