OPEN-SOURCE SCRIPT
Atualizado Seasonal Performance for Stocks & Crypto

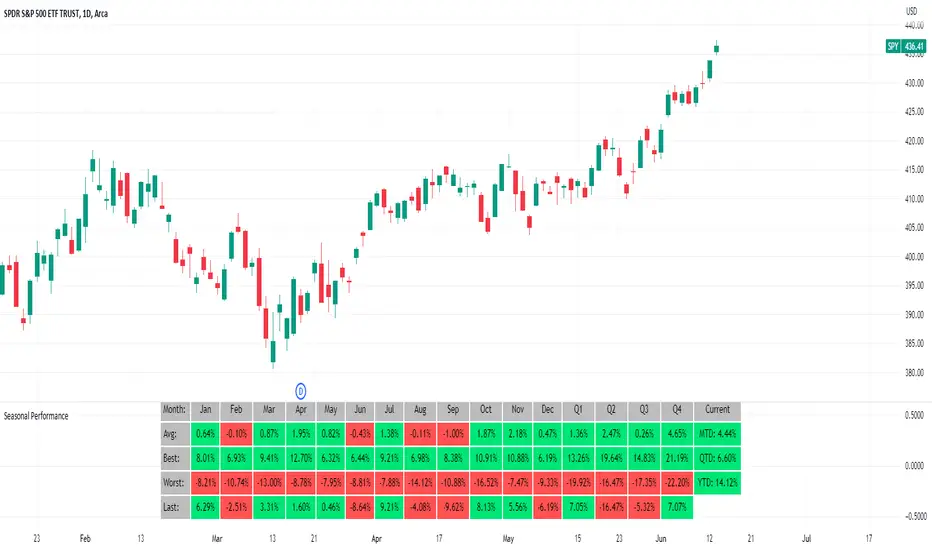
The Seasonal Performance indicator quickly allows you to see if you are in a bullish or bearish time of year for an underlying security and where the current performance stacks up compared to the same time of year historically. Table is fully customizable from colors to what data to see.
Table Displays
Note this indicator will only work with Stocks, ETF's, Index's or Crypto.
Table Displays
- Average Performance
- Best Performance
- Worst Performance
- Last Performance
- Current Performance
Note this indicator will only work with Stocks, ETF's, Index's or Crypto.
Notas de Lançamento
Added ability to see the number of times each month or quarter was bullish or bearishScript de código aberto
Em verdadeiro espírito do TradingView, o criador deste script o tornou de código aberto, para que os traders possam revisar e verificar sua funcionalidade. Parabéns ao autor! Embora você possa usá-lo gratuitamente, lembre-se de que a republicação do código está sujeita às nossas Regras da Casa.
Trusted Pine programmer. Send me a message for script development.
Aviso legal
As informações e publicações não se destinam a ser, e não constituem, conselhos ou recomendações financeiras, de investimento, comerciais ou de outro tipo fornecidos ou endossados pela TradingView. Leia mais nos Termos de Uso.
Script de código aberto
Em verdadeiro espírito do TradingView, o criador deste script o tornou de código aberto, para que os traders possam revisar e verificar sua funcionalidade. Parabéns ao autor! Embora você possa usá-lo gratuitamente, lembre-se de que a republicação do código está sujeita às nossas Regras da Casa.
Trusted Pine programmer. Send me a message for script development.
Aviso legal
As informações e publicações não se destinam a ser, e não constituem, conselhos ou recomendações financeiras, de investimento, comerciais ou de outro tipo fornecidos ou endossados pela TradingView. Leia mais nos Termos de Uso.