PROTECTED SOURCE SCRIPT
Atualizado CandlestickPatterns

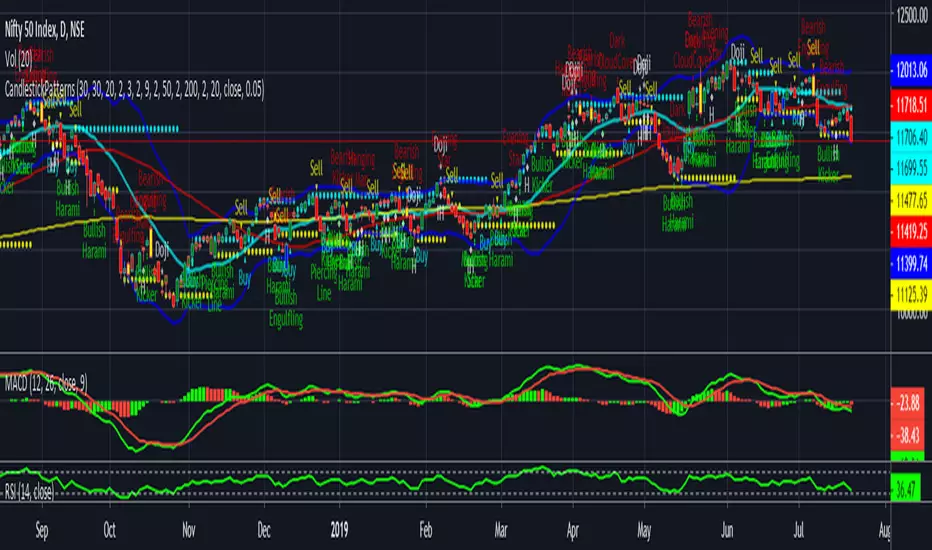
If moving average SMA (green line) crosses above SMA (red line) is uptrend , stock price will move up gradually. If suppose moving average SMA (green line) crosses below SMA (red line) is downtrend, stock price will move down. Also please validate with MACD & RSI for reference will get more clarification.
The default script have:
1) Bollinger Bands
2) Moving Average
3) Buy & Sell Signals
4) Engulfing patterns (like Doji , Bearish Harami, Bullish Harami, Bearish Engulfing , Bullish Engulfing , Piercing Line, Bullish Belt, Bullish Kicker, and Bearish Kicker)
The Piercing Line, Bullish Belt, and the Kickers will usually show up better in the daily charts.
Notas de Lançamento
If moving average SMA (green line) crosses above SMA (red line) is uptrend , stock price will move up gradually. If suppose moving average SMA (green line) crosses below SMA (red line) is downtrend, stock price will move down. Also please validate with MACD & RSI for reference will get more clarification. The default script have:
1) Bollinger Bands
2) Moving Average
3) Buy & Sell Signals
4) Engulfing patterns (like Doji , Bearish Harami, Bullish Harami, Bearish Engulfing , Bullish Engulfing , Piercing Line, Bullish Belt, Bullish Kicker, and Bearish Kicker)
The Piercing Line, Bullish Belt, and the Kickers will usually show up better in the daily charts.
#update only buy & sell signal identification with new triangle symbol.
Notas de Lançamento
++Engulfing Colour ChangeNotas de Lançamento
Update Support and Resistance are added.support--> Orange Colour
Resistance--> Aqua Colour
Notas de Lançamento
#Moving Averages SMA50 & SMA200 are added.Notas de Lançamento
#Colour DetailsSMA3--> lime
SMA9--> red
SMA20--> green
SMA50--> fuchsia
SMA200--> orange
Support--> yellow
Resistance--> aqua
Notas de Lançamento
## 50days and 200days SMA color change 50days SMA--> orange
200days SMA--> yellow
Notas de Lançamento
##Notas de Lançamento
#20 days MA colour--> AquaNotas de Lançamento
Update with Support and ResistanceNotas de Lançamento
colour change Script protegido
Esse script é publicada como código fechado. No entanto, você pode gerenciar suas escolhas de bate-papo. Por favor, abra suas Configurações do perfil
Aviso legal
As informações e publicações não se destinam a ser, e não constituem, conselhos ou recomendações financeiras, de investimento, comerciais ou de outro tipo fornecidos ou endossados pela TradingView. Leia mais nos Termos de Uso.
Script protegido
Esse script é publicada como código fechado. No entanto, você pode gerenciar suas escolhas de bate-papo. Por favor, abra suas Configurações do perfil
Aviso legal
As informações e publicações não se destinam a ser, e não constituem, conselhos ou recomendações financeiras, de investimento, comerciais ou de outro tipo fornecidos ou endossados pela TradingView. Leia mais nos Termos de Uso.