OPEN-SOURCE SCRIPT
Day-of-Week Performance
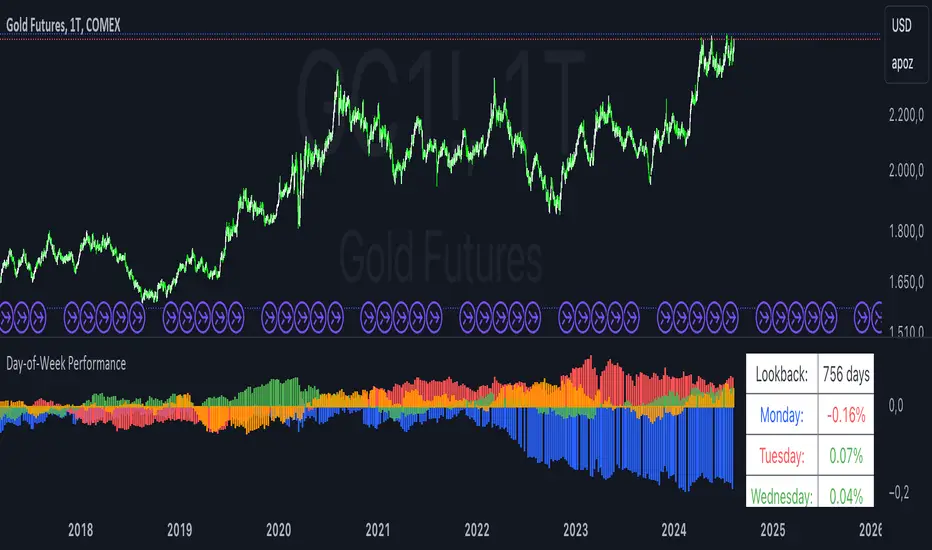
This Pine Script indicator calculates and displays the average performance for each weekday over a specified lookback period on a chart. The performance is computed based on the percentage change from the open to the close price of each day.
Features:
Lookback Period:
Input field to specify the number of days to look back for calculating performance. The default is set to 756 days.
Performance Calculation:
Calculates the average percentage change from open to close for each weekday (Monday through Friday) within the specified lookback period.
Histogram Plots:
Displays histograms on the chart for each weekday. Each histogram represents the average performance of that day of the week.
Histograms are plotted with distinct colors:
Monday: Blue
Tuesday: Red
Wednesday: Green
Thursday: Orange
Friday: Purple
Performance Table:
A table is displayed in the top-right corner of the chart showing the average percentage performance for each weekday.
The table updates with the lookback period and the calculated average performance values for each weekday.
Positive performance values are shown in green, and negative values are shown in red.
This indicator helps visualize day-of-the-week performance trends, providing insights into which days typically perform better or worse over the specified period.
Script de código aberto
Em verdadeiro espírito do TradingView, o criador deste script o tornou de código aberto, para que os traders possam revisar e verificar sua funcionalidade. Parabéns ao autor! Embora você possa usá-lo gratuitamente, lembre-se de que a republicação do código está sujeita às nossas Regras da Casa.
Where others speculate, we systematize.
edgetools.org
edgetools.org
Aviso legal
As informações e publicações não se destinam a ser, e não constituem, conselhos ou recomendações financeiras, de investimento, comerciais ou de outro tipo fornecidos ou endossados pela TradingView. Leia mais nos Termos de Uso.