PROTECTED SOURCE SCRIPT
Absolute Volume Levels MA [AlgoRich]
This script allows you to:
Choose between dynamic or static thresholds to classify the volume of the bars.
Select the type of moving average (SMA, EMA, RMA, or KAMA) and the period for calculating the volume's moving average, making it easier to adapt to different asset behaviors and volatilities.
Configure multiplier factors that determine the intermediate and strong thresholds based on the volume's moving average.
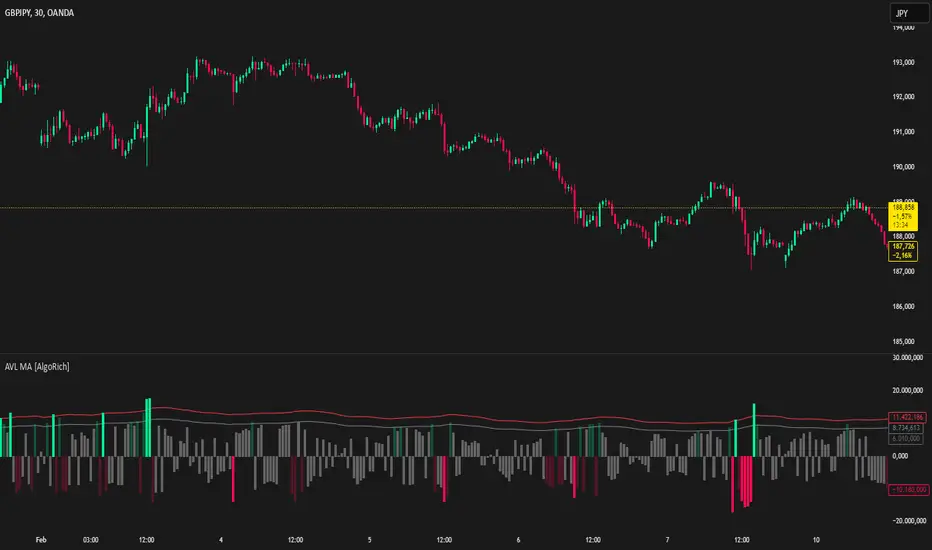
Assign differentiated colors for bullish and bearish bars, depending on whether the volume is weak, intermediate, or strong.
Visualize the classified volume in a histogram, which helps quickly identify the bars with the highest activity.
This flexibility and customization allow the indicator to adapt to various assets and timeframes, providing a robust visual tool for analyzing volume behavior.
Choose between dynamic or static thresholds to classify the volume of the bars.
Select the type of moving average (SMA, EMA, RMA, or KAMA) and the period for calculating the volume's moving average, making it easier to adapt to different asset behaviors and volatilities.
Configure multiplier factors that determine the intermediate and strong thresholds based on the volume's moving average.
Assign differentiated colors for bullish and bearish bars, depending on whether the volume is weak, intermediate, or strong.
Visualize the classified volume in a histogram, which helps quickly identify the bars with the highest activity.
This flexibility and customization allow the indicator to adapt to various assets and timeframes, providing a robust visual tool for analyzing volume behavior.
Script protegido
Esse script é publicada como código fechado. No entanto, você pode gerenciar suas escolhas de bate-papo. Por favor, abra suas Configurações do perfil
Aviso legal
As informações e publicações não se destinam a ser, e não constituem, conselhos ou recomendações financeiras, de investimento, comerciais ou de outro tipo fornecidos ou endossados pela TradingView. Leia mais nos Termos de Uso.