OPEN-SOURCE SCRIPT
Atualizado Seasonality Table - Tabular Form
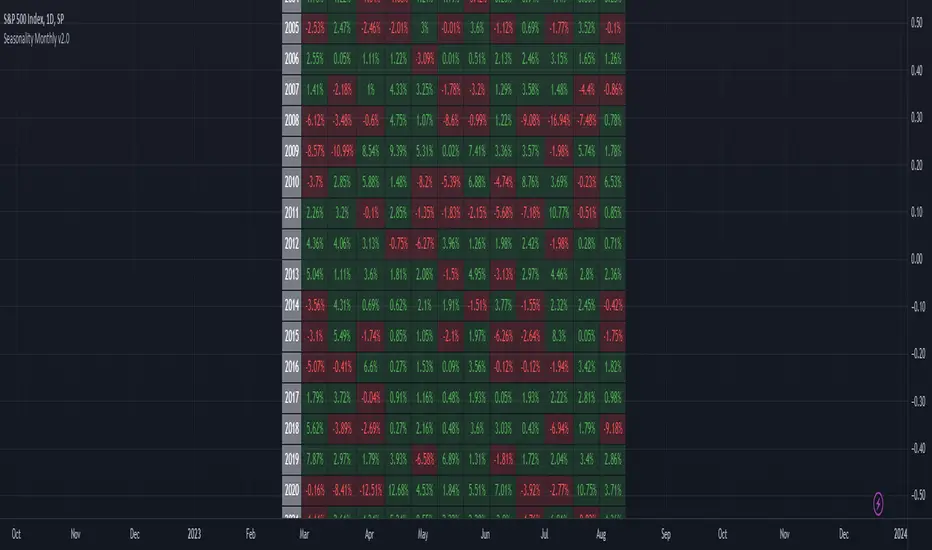
This indicator displays the seasonality data for any instrument (index/stock/futures/currency) in a tabular data.
User can change the start of the year for analysis from the inputs.
Year is represented in rows and Month is represented in cols.
This indicator uses Monthly Data feed to calculate the % change
Summary data for the month is displayed as the last row
User can change the start of the year for analysis from the inputs.
Year is represented in rows and Month is represented in cols.
This indicator uses Monthly Data feed to calculate the % change
Summary data for the month is displayed as the last row
Notas de Lançamento
Updated chartNotas de Lançamento
Switched to Daily feed from Monthly as Monthly feed is not reliable for US futures dataNotas de Lançamento
Added versioningNotas de Lançamento
- Added a new row at the bottom to show positive / total count
Notas de Lançamento
Fixed US Futures Sunday Open issueNotas de Lançamento
Switched calculation to Monthly close levels instead of accumulating % Daily Gains.Script de código aberto
Em verdadeiro espírito do TradingView, o criador deste script o tornou de código aberto, para que os traders possam revisar e verificar sua funcionalidade. Parabéns ao autor! Embora você possa usá-lo gratuitamente, lembre-se de que a republicação do código está sujeita às nossas Regras da Casa.
Aviso legal
As informações e publicações não se destinam a ser, e não constituem, conselhos ou recomendações financeiras, de investimento, comerciais ou de outro tipo fornecidos ou endossados pela TradingView. Leia mais nos Termos de Uso.
Script de código aberto
Em verdadeiro espírito do TradingView, o criador deste script o tornou de código aberto, para que os traders possam revisar e verificar sua funcionalidade. Parabéns ao autor! Embora você possa usá-lo gratuitamente, lembre-se de que a republicação do código está sujeita às nossas Regras da Casa.
Aviso legal
As informações e publicações não se destinam a ser, e não constituem, conselhos ou recomendações financeiras, de investimento, comerciais ou de outro tipo fornecidos ou endossados pela TradingView. Leia mais nos Termos de Uso.