Yearly Levels for Day Traders
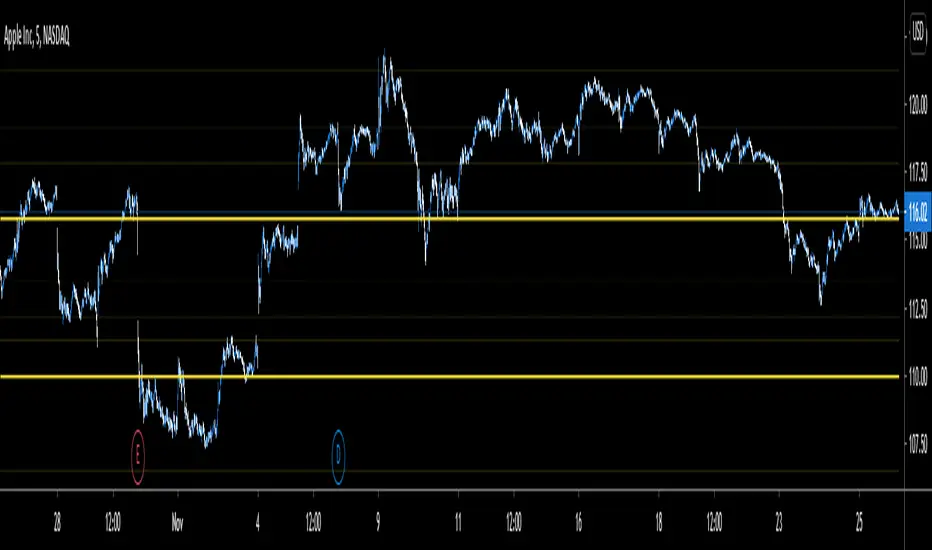
The script is useful in identifying price levels for the short term trading. The inputs are based on Fibonacci ratios but on yearly basis.
You will need to enter the pair ratio for where the stock is between ( I will show you).
Those pairs are as follows:
R1/R2
(0/0.23)
(.23/.38)
(.38/.61)
(.61/1)
(1/1.61)
(1.61/2.61)
(2.61/4.23)
(4.23/6.859)
(6.85/11.08)
(11.08/17.94)
(17.94/29.05)
(29.05/46.95)
(46.95/75.99)
(75.99/122.99)
I personally added the indicator multiple times to a template and put in all the pairs so I do not have to enter the pair each time.
The script does not tell you which level is a bottom or a top. Your experience matters.
If you are interested please PM me the username:
Script sob convite
Somente usuários aprovados pelo autor podem acessar este script. Você precisará solicitar e obter permissão para usá-lo. Normalmente, essa permissão é concedida após o pagamento. Para obter mais detalhes, siga as instruções do autor abaixo ou entre em contato diretamente com malrawi.
A TradingView NÃO recomenda pagar ou usar um script, a menos que você confie totalmente em seu autor e entenda como ele funciona. Você também pode encontrar alternativas gratuitas e de código aberto em nossos scripts da comunidade.
Instruções do autor
Aviso legal
Script sob convite
Somente usuários aprovados pelo autor podem acessar este script. Você precisará solicitar e obter permissão para usá-lo. Normalmente, essa permissão é concedida após o pagamento. Para obter mais detalhes, siga as instruções do autor abaixo ou entre em contato diretamente com malrawi.
A TradingView NÃO recomenda pagar ou usar um script, a menos que você confie totalmente em seu autor e entenda como ele funciona. Você também pode encontrar alternativas gratuitas e de código aberto em nossos scripts da comunidade.