OPEN-SOURCE SCRIPT
Atualizado Price Action Signals V2
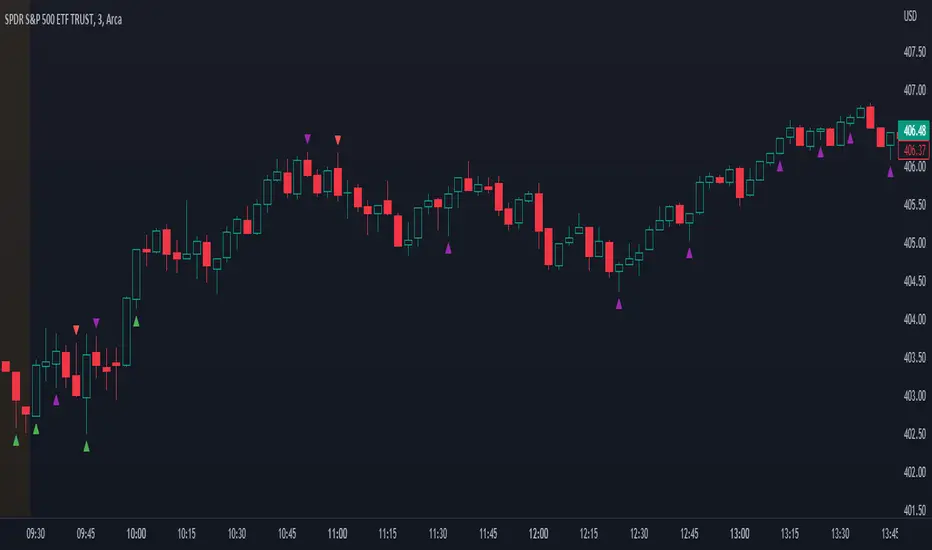
Indicator that shows buy/sell signals based on price action and volume as it relates to a double EMA. If the candle is above the double EMA, we look for candles with long wicks on the top indicating selling pressure. If the candle is below the double EMA , we look for candles with a long bottom wick indicating buying pressure. The user defined parameters are the length of the double EMA and the length of the volume moving average. Lower timeframes such as 5 minutes and lower are better off using lower lengths while higher timeframes should user higher lengths. Your mileage will vary.
Note, while this indicator can signal the beginning of long term trends, it will also signal minor retracements. Do not blindly buy or sell based on a signal appearing, pay attention to where the candle is in the overall trend and wait for confirmation to avoid losses.
Note, while this indicator can signal the beginning of long term trends, it will also signal minor retracements. Do not blindly buy or sell based on a signal appearing, pay attention to where the candle is in the overall trend and wait for confirmation to avoid losses.
Notas de Lançamento
Chart update to show intraday.Notas de Lançamento
Changed default setting for showing the Double EMA and commented out plots that aren't needed.Notas de Lançamento
Made some updates for more granular control. There's now a spread you can choose for candles to determine what makes a candle large, an irregular body setting to determine what you consider to be an irregular candle spread on large volume. I also changed the default set up for intraday trading.- Fixed bug with plot showing at bottom of the chart, which was squishing the entire chart.
Notas de Lançamento
Added notes for the colors of arrows. Red and green candles denote strong market movement, purple arrows denote weakness and possible reversals.Notas de Lançamento
Removed candle color condition for more accurate results.Notas de Lançamento
Added check to make sure that we don't put two arrows on one candle.Notas de Lançamento
Finally got rid of the moving average separator. Purple arrows now mean small spread OR low volume with strong price action.Notas de Lançamento
Added the ability to remove irregular arrows from display to keep indicator more clean. Also changed default settings.Notas de Lançamento
Added high volume condition to irregular bodies.Notas de Lançamento
Updated chartNotas de Lançamento
Had to remove extra indicator for new chartNotas de Lançamento
Fixed bug that caused a buy arrow and sell arrow to show up at the same time.Script de código aberto
Em verdadeiro espírito do TradingView, o criador deste script o tornou de código aberto, para que os traders possam revisar e verificar sua funcionalidade. Parabéns ao autor! Embora você possa usá-lo gratuitamente, lembre-se de que a republicação do código está sujeita às nossas Regras da Casa.
Aviso legal
As informações e publicações não se destinam a ser, e não constituem, conselhos ou recomendações financeiras, de investimento, comerciais ou de outro tipo fornecidos ou endossados pela TradingView. Leia mais nos Termos de Uso.
Script de código aberto
Em verdadeiro espírito do TradingView, o criador deste script o tornou de código aberto, para que os traders possam revisar e verificar sua funcionalidade. Parabéns ao autor! Embora você possa usá-lo gratuitamente, lembre-se de que a republicação do código está sujeita às nossas Regras da Casa.
Aviso legal
As informações e publicações não se destinam a ser, e não constituem, conselhos ou recomendações financeiras, de investimento, comerciais ou de outro tipo fornecidos ou endossados pela TradingView. Leia mais nos Termos de Uso.