OPEN-SOURCE SCRIPT
Volume 2x Average
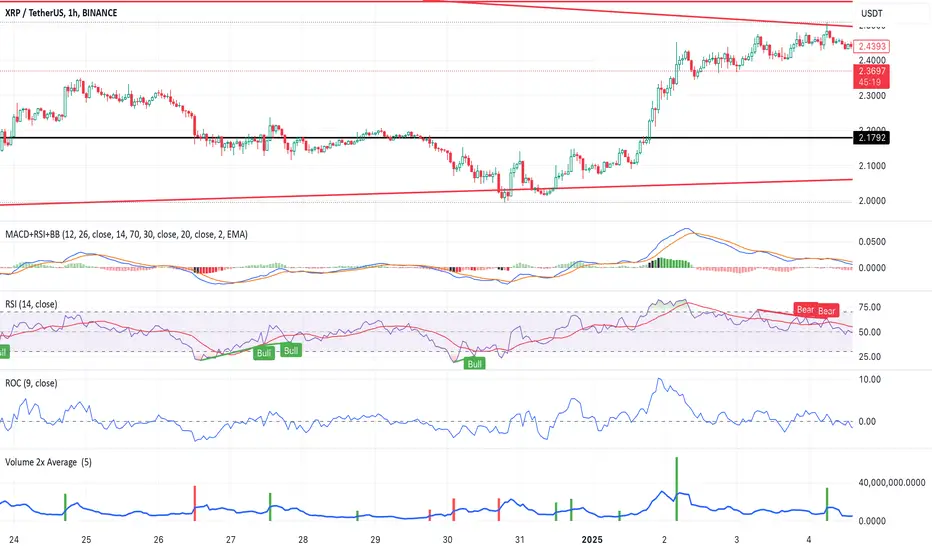
This script helps traders identify stocks or instruments experiencing unusually high trading volume compared to their average volume over a user-defined period. The key features include:
1. Volume 2x Average Filter:
Highlights bars where the current volume is greater than twice the average volume for the selected period.
2. Dynamic Average Period:
Allows users to specify the period for calculating the average volume (e.g., 1 day, 5 days, etc.).
3. Color-Coded Bars:
• Green Bars: Indicate bullish candlesticks where the closing price is higher than the
opening price.
• Red Bars: Indicate bearish candlesticks where the closing price is lower than the
opening price.
4. Optional Bar Visibility:
Users can toggle the visibility of the highlighted volume bars, providing flexibility for clean chart analysis.
5. Average Volume Line:
Plots the average volume as a blue line for reference.
Use Case:
This script is ideal for traders looking to identify potential breakouts, reversals, or key market movements driven by significant volume spikes. By dynamically adjusting the average period and toggling bar visibility, users can tailor the script to fit various trading strategies and timeframes.
Inputs:
1. Show 2x Volume Bars:
• Toggle to enable or disable the display of the highlighted volume bars.
2. Average Volume Period:
• Specify the number of periods (e.g., 1 for 1 day, 5 for 5 days) to calculate the average
volume.
Disclaimer:
This script is for educational purposes only and does not constitute financial advice. Use it alongside your analysis and trading strategy.
Script de código aberto
Em verdadeiro espírito do TradingView, o criador deste script o tornou de código aberto, para que os traders possam revisar e verificar sua funcionalidade. Parabéns ao autor! Embora você possa usá-lo gratuitamente, lembre-se de que a republicação do código está sujeita às nossas Regras da Casa.
Aviso legal
As informações e publicações não se destinam a ser, e não constituem, conselhos ou recomendações financeiras, de investimento, comerciais ou de outro tipo fornecidos ou endossados pela TradingView. Leia mais nos Termos de Uso.