OPEN-SOURCE SCRIPT
Atualizado Euler Cubes - Cubᵋ

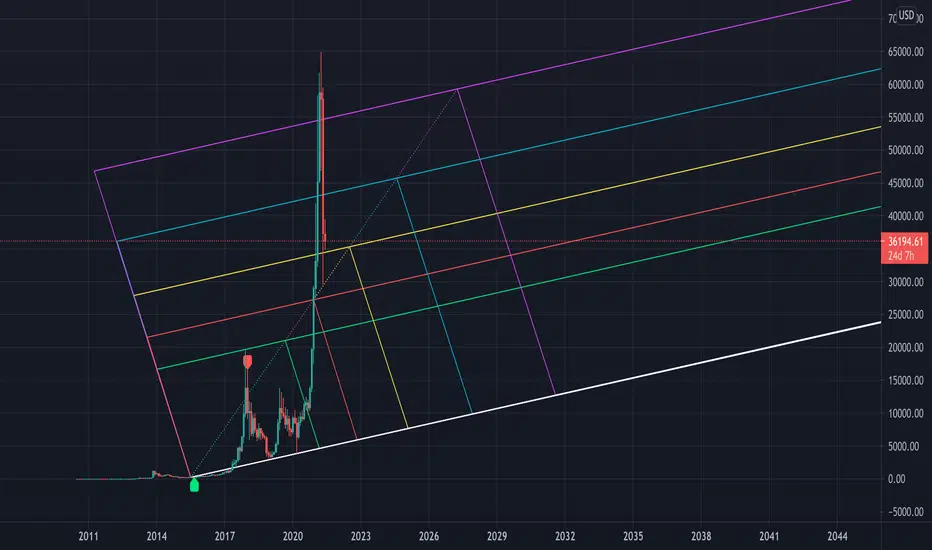
I give you the "Euler Cubes", inspired by the mathematical number 'e' (Euler's number).
It is suggested (fibonacci ratios analogy) that price/e ratio can give Support/Resistance area's.
The first cube is made by a low/high of choice, for example:

You set the 'source low'/'source high' in position:

Then you choose the 'e ratio' (x times 'e')
This multiplies the distance 'high-low' times '0.271828' times 'the set number'.
For example, choosing 5 gives 5x 0.271828 = 1.35914, the distance 'high-low' hereby multiplied by 1.35914, the following cubes multiply the previous distance by 1.35914.
(Settings below 5 will give cubes smaller than the 'high-low' distance)
In the case of x times 'e' = 5:

You can extend the lines:

Now you can give it an angle:


Do mind, using it over very little bars and using an angle can cause some lines to not align as intended, because for now, it is not possible to plot in between bars.

There are also 'Euler' SMA and EMA available with following length's:
27, 54, 82,109, 136, 163, 190 and 217


Cheers!
It is suggested (fibonacci ratios analogy) that price/e ratio can give Support/Resistance area's.
The first cube is made by a low/high of choice, for example:
You set the 'source low'/'source high' in position:
Then you choose the 'e ratio' (x times 'e')
This multiplies the distance 'high-low' times '0.271828' times 'the set number'.
For example, choosing 5 gives 5x 0.271828 = 1.35914, the distance 'high-low' hereby multiplied by 1.35914, the following cubes multiply the previous distance by 1.35914.
(Settings below 5 will give cubes smaller than the 'high-low' distance)
In the case of x times 'e' = 5:
You can extend the lines:
Now you can give it an angle:
Do mind, using it over very little bars and using an angle can cause some lines to not align as intended, because for now, it is not possible to plot in between bars.
There are also 'Euler' SMA and EMA available with following length's:
27, 54, 82,109, 136, 163, 190 and 217
Cheers!
Notas de Lançamento
When you want to choose a bar way back in history, you can enable 'Year - Month - Day', choose the date, and work from there further back
Notas de Lançamento
Added constant's:- Euler-Mascheroni constant gamma γ = 0.57721566490153286060651209008240243...
('Euler's constant', not to be confused with the constant e=2.718281...)
- golden ratio conjugate constant = 0.6180339887498948 = math.rphi
- the golden ratio constant = 1.6180339887498948 = math.phi
- Euler's number (Leonhard Euler) e = 2,71828182845904523536028747135266249... = math.e
- Archimedes' constant pi π = 3.1415926535897932 = math.pi
- constant of Mitchell Feigenbaum δ ≈ 4.66920160910299067185320382046620161...
Script de código aberto
Em verdadeiro espírito do TradingView, o criador deste script o tornou de código aberto, para que os traders possam revisar e verificar sua funcionalidade. Parabéns ao autor! Embora você possa usá-lo gratuitamente, lembre-se de que a republicação do código está sujeita às nossas Regras da Casa.
Who are PineCoders?
tradingview.com/chart/SSP/yW5eOqtm-Who-are-PineCoders/
TG Pine Script® Q&A: t.me/PineCodersQA
- We cannot control our emotions,
but we can control our keyboard -
tradingview.com/chart/SSP/yW5eOqtm-Who-are-PineCoders/
TG Pine Script® Q&A: t.me/PineCodersQA
- We cannot control our emotions,
but we can control our keyboard -
Aviso legal
As informações e publicações não se destinam a ser, e não constituem, conselhos ou recomendações financeiras, de investimento, comerciais ou de outro tipo fornecidos ou endossados pela TradingView. Leia mais nos Termos de Uso.