PROTECTED SOURCE SCRIPT
Trend Momentum - Tradingriot
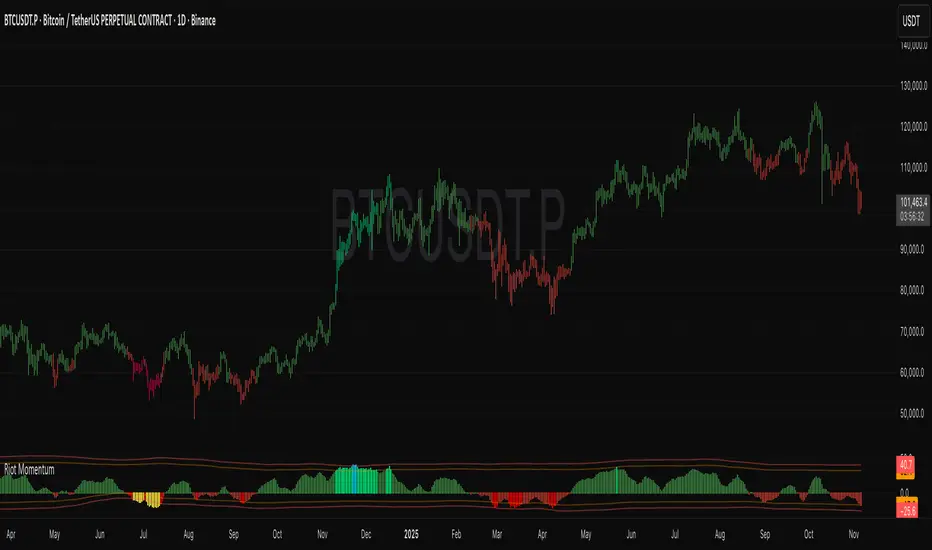
Riot Momentum blends three robust and momentum components into one normalized oscillator built for daily trend identification:
Inspired by Advanced Futures Trading Strategies book by Robert Carver
1. EWMAC Trend (8/32, 16/64, 32/128)
Three exponential moving-average crossover pairs, normalized by realized volatility. This captures fast, medium, and slow trend behavior. Signals are smoothed through ensemble averaging.
2. Breakout Trend (20, 40, 80-day)
Classic Donchian-style breakout logic. The script measures where price sits inside its rolling range, scales it to a forecast value, and smooths it based on Carver’s recommended span. This captures structural market shifts that EMAs miss.
3. Acceleration / ROC Shift
Short-term rate-of-change of momentum, normalized by volatility. This highlights inflection points and early trend transitions.
The three systems are combined with fixed weights and clipped to a ±20 forecast cap. The final value is rescaled to a ±100 histogram for intuitive reading.
Z-Score Regime Framework
The combined momentum is wrapped in a statistical regime filter using a rolling Z-score:
Normal: |Z| < 1.5
Elevated: 1.5 ≤ |Z| < 2.0
Peak: |Z| ≥ 2.0
The histogram automatically adapts its color based on:
Signal direction (long vs short)
Z-score regime (normal, elevated, peak)
This gives immediate context: not only what the trend is, but how statistically stretched it is relative to the past year.
Optional Z-score bands and mean line help visualize regime behavior over time.
Candle Coloring
Bars can optionally take on the histogram’s regime-aware coloring, making full-chart trend state obvious at a glance.
Alerts
Built-in alerts:
Momentum turning long
Momentum turning short
Z-score reaching peak extremes
Z-score reverting back toward normal
How to Use
This is a multi-factor trend filter, not a trade-entry generator. It excels at:
Trend following
Regime classification
Identifying exhaustion/extremes
Filtering whipsaw environments
Portfolio rotation and timing models
Use the histogram direction for high-level trend bias. Use the Z-score color transitions to gauge stretch and mean-reversion risk.
Script protegido
Esse script é publicada como código fechado. No entanto, você pode usar ele livremente e sem nenhuma limitação – saiba mais aqui.
Aviso legal
As informações e publicações não devem ser e não constituem conselhos ou recomendações financeiras, de investimento, de negociação ou de qualquer outro tipo, fornecidas ou endossadas pela TradingView. Leia mais em Termos de uso.