INVITE-ONLY SCRIPT
13/48 EMA SMT Indicator
Atualizado

Please ensure you enable extended hours on your chart in TradingView This indicator is best used with a real-time data subscription to NYSE (Arca)
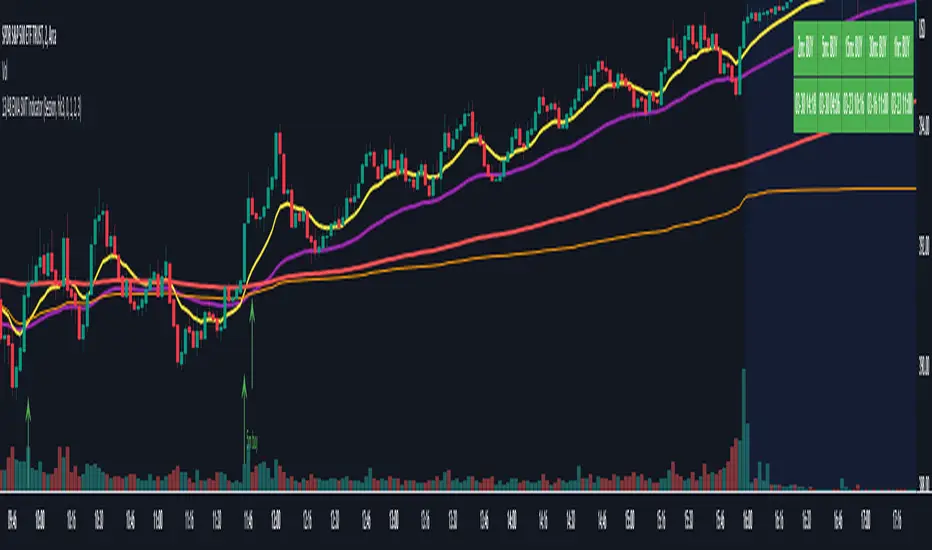
The script will plot the following EMAs:
13, 48, and 200
The script will also plot VWAP (Volume Weighted Average Price)
The user will be able to choose what color and format the EMA will be in but the periods are set.
The indicator's primary purpose is to look for areas of potential momentum shifts (i.e. ema crossovers). However, this indicator is unique in that it will only give a signal if 2 other criteria are met along with the 13 and 48 ema crossover.
The criteria are as follows:
A "sell" signal will be generated if a bearish 13/48 ema crossover occurs while 2 other confirming conditions are present. Alerts are configurable.
A "buy" signal will be generated if a bullish 13/48 ema crossover occurs while while 2 other confirming conditions are present. Alerts are configurable
Additional functionality of the indicator:
- Added capability to display 2m, 5m, 15m, 30m, and 1h signals on the same time frame! (I recommend 2m or 5m for best trade setups)
- You can enable or disable signals for any time frame in the indicator settings
- You can now set alerts for any of the defined timeframes above without having to switch charts
- Added a color coded dashboard that does the following
- Displays most recent signal on all time frames
- Says whether the signal was a buy or sell signal and colors the cell accordingly
- Gives the exact time and date the last signal occurred at
Notas de Lançamento
- Added key levels indicator into the script itself- Removed a loop that caused performance issues: should be lag free now
- Added the option for 3m tf
-Added the option for the user to choose which tf are displayed on the dashboard
- Fixed an issue with bearish signals
Notas de Lançamento
- Added 10 minute time frame- Added dynamic support/resistance level that tracks price in real time
- Added "Chop Filter" + button to disable in one click
- Optimal settings given with access to code
- Added the ability to restrict signals/alerts to the desire time window the user desires (i.e. 9:30-16:00, 9:30-9:30 (for extended hours), etc.)
- Added the ability to enable/disable labeling on dynamic S/R
Notas de Lançamento
Updated alerts functionalityNotas de Lançamento
Chop indicator is now OFF by defaultNotas de Lançamento
Replaced 1hr tf with 65m tfNotas de Lançamento
Made S/R labels text instead as not to impede visibilityNotas de Lançamento
Updated order of 2m and 3m signals in table and indicator settingsNotas de Lançamento
Fixed inverted colors for 2m and 3m on dashboardNotas de Lançamento
Added option to enable EMA cloud.- User can choose the colors for bullish and bearish clouds
- User can choose the transparency for the clouds
Script sob convite
O acesso a este script é restrito aos usuários autorizados pelo autor e pode requerir pagamento. Você pode adicioná-lo a seus favoritos, mas só poderá utilizá-lo após solicitar permissão e obtê-la do autor. Contate StockManTrading para mais informações, ou siga as instruções do autor abaixo.
Observe que este é um script sob convite privado que não foi analisado pelos moderadores de scripts. Sua adequação as Regras da Casa é indeterminada. O TradingView não sugere pagar por um script e usá-lo, a menos que você confie 100% no seu autor e entenda como o script funciona. Em muitos casos, você pode encontrar uma boa alternativa de código aberto gratuita nos nossos Scripts da Comunidade.
Quer usar esse script no gráfico?
Aviso: por favor leia antes de solicitar acesso.
Aviso legal
As informações e publicações não devem ser e não constituem conselhos ou recomendações financeiras, de investimento, de negociação ou de qualquer outro tipo, fornecidas ou endossadas pela TradingView. Leia mais em Termos de uso.