OPEN-SOURCE SCRIPT
Atualizado Volume Forecast
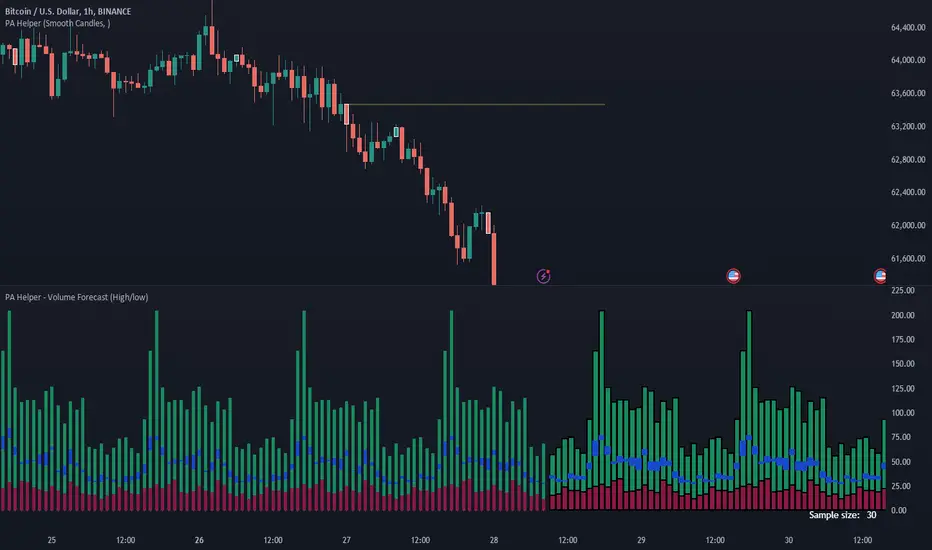
The Volume Forecast indicator on TradingView is a comprehensive tool designed to analyze historical price action and project future market movements based on the average sizes of candles. Incorporating various data points such as candle high/low, open/close, and real volumes, Volume Forecast provides traders with a holistic view of market dynamics, allowing for more informed decision-making.
Key Features:
Multi-Data Source Analysis:
Volume Forecast seamlessly integrates multiple data sources, including candle high/low, open/close prices, and real volumes. By considering these diverse elements, the indicator offers a nuanced understanding of market conditions.
Historical Candle Size Analysis:
The indicator conducts a thorough analysis of historical candle sizes, capturing key data points to calculate the average candle size over a specified period. This historical context serves as the foundation for forecasting future candle sizes.
Customizable Forecasting Parameters:
Traders have the flexibility to fine-tune forecasting parameters to align with their trading strategies. Whether focusing on open/close relationships, high/low points, or real volumes, users can customize the indicator to suit their preferences.
Predictive Algorithm:
Volume Forecast employs a sophisticated predictive algorithm that leverages historical candle size data to project the potential size of upcoming candles. This algorithmic approach enhances the indicator's accuracy in forecasting market movements.
Visual Clarity:
The indicator provides a clear visual representation on the TradingView chart, displaying historical candle sizes and forecasted values. Color-coded elements and visual cues help traders quickly interpret the data, facilitating timely decision-making.
Adaptive Real-Time Updates:
Volume Forecast dynamically updates in real-time, ensuring traders have access to the latest information. This adaptability allows for swift adjustments to trading strategies in response to changing market conditions.
Comprehensive Market Compatibility:
Whether trading stocks, forex, cryptocurrencies, or commodities, Volume Forecast is compatible across various financial instruments and timeframes. This versatility makes it a valuable asset for traders in different markets.
User-Friendly Interface:
With an intuitive interface, Volume Forecast is accessible to traders of all experience levels. The indicator's user-friendly design streamlines the analysis process, making it easier for traders to incorporate it into their trading routines.
In summary, Volume Forecast is a robust TradingView indicator that combines historical candle size analysis with advanced forecasting techniques. By incorporating multiple data sources and offering customization options, it empowers traders to make more informed decisions in anticipation of market movements. Whether used independently or in conjunction with other tools, Volume Forecast is a valuable asset for traders seeking a comprehensive understanding of market dynamics.
Notas de Lançamento
Cosmetic update- better visualization when zooming out
Notas de Lançamento
Added error margin in plotting averages based on last N number of barsNotas de Lançamento
Added possibility of filtering hoursNotas de Lançamento
Added push measurement: the difference between session open and session closeNotas de Lançamento
Customizable session push overviewNotas de Lançamento
Revamped the forecasting system and a friendlier UIScript de código aberto
Em verdadeiro espírito do TradingView, o criador deste script o tornou de código aberto, para que os traders possam revisar e verificar sua funcionalidade. Parabéns ao autor! Embora você possa usá-lo gratuitamente, lembre-se de que a republicação do código está sujeita às nossas Regras da Casa.
eBacktesting.com
--------
Check out the most complete backtesting suite integrated on TradingView!
Join our free Discord group for more info, Q&A, and education:
discord.gg/kJSmwSxBpW
--------
Check out the most complete backtesting suite integrated on TradingView!
Join our free Discord group for more info, Q&A, and education:
discord.gg/kJSmwSxBpW
Aviso legal
As informações e publicações não se destinam a ser, e não constituem, conselhos ou recomendações financeiras, de investimento, comerciais ou de outro tipo fornecidos ou endossados pela TradingView. Leia mais nos Termos de Uso.
Script de código aberto
Em verdadeiro espírito do TradingView, o criador deste script o tornou de código aberto, para que os traders possam revisar e verificar sua funcionalidade. Parabéns ao autor! Embora você possa usá-lo gratuitamente, lembre-se de que a republicação do código está sujeita às nossas Regras da Casa.
eBacktesting.com
--------
Check out the most complete backtesting suite integrated on TradingView!
Join our free Discord group for more info, Q&A, and education:
discord.gg/kJSmwSxBpW
--------
Check out the most complete backtesting suite integrated on TradingView!
Join our free Discord group for more info, Q&A, and education:
discord.gg/kJSmwSxBpW
Aviso legal
As informações e publicações não se destinam a ser, e não constituem, conselhos ou recomendações financeiras, de investimento, comerciais ou de outro tipo fornecidos ou endossados pela TradingView. Leia mais nos Termos de Uso.