OPEN-SOURCE SCRIPT
Stochastic Structure Analyzer
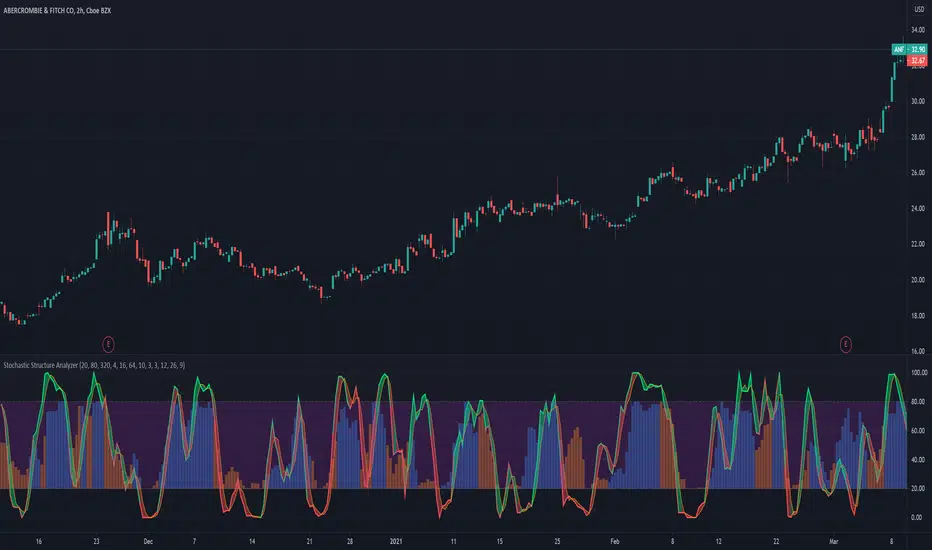
A momentum indicator that uses the highest and lowest values for price in three different lookback lengths to find the performance relative to three timeframes.
- Stochastic can be used for buy and sell signals as usual.
- The bars at the back represent the stochastic value of the OBV based structure calculation.
- The color of the stochastic line is a preliminary indicator of an up move.
- The fill color between the stochastic lines indicate the trend strength,
How to use: I suggest combining this with a higher timeframe to buy when the both stochastics are crossing below 20 line. And sell when one of the stochastics crosses-down.
This is the stochastic version of the structure analyzer(tradingview.com/script/66qgS9gj-Structure-Analyzer/).
Script de código aberto
Em verdadeiro espírito do TradingView, o criador deste script o tornou de código aberto, para que os traders possam revisar e verificar sua funcionalidade. Parabéns ao autor! Embora você possa usá-lo gratuitamente, lembre-se de que a republicação do código está sujeita às nossas Regras da Casa.
Aviso legal
As informações e publicações não se destinam a ser, e não constituem, conselhos ou recomendações financeiras, de investimento, comerciais ou de outro tipo fornecidos ou endossados pela TradingView. Leia mais nos Termos de Uso.