OPEN-SOURCE SCRIPT
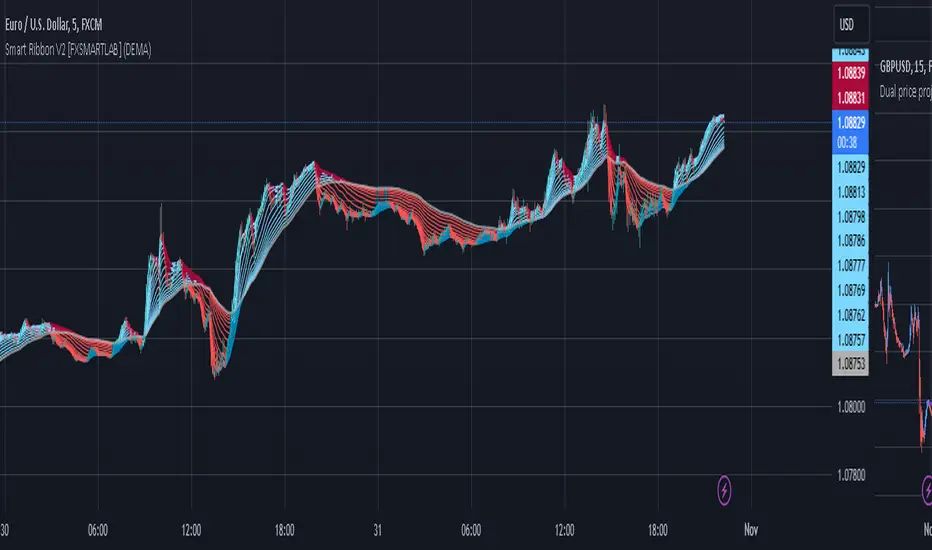
Smart Ribbon V2 [FXSMARTLAB]

The Smart Ribbon V2 indicator is designed to analyze market trends and momentum by plotting a series of moving averages with varying periods, all within a single overlay on the price chart. This approach creates a "ribbon" effect, enabling traders to visualize trend strength, reversals, and potential entry or exit points. The indicator provides flexibility through different moving average types, including some advanced ones like QUEMA (Quadruple Exponential Moving Average) and QuintEMA (Quintuple Exponential Moving Average). Each moving average is color-coded to indicate trend direction and momentum, making it visually intuitive and effective for quick decision-making in trend-following strategies.
The Smart Ribbon V2 helps traders:
Detailed Explanation of QUEMA and QuintEMA
The QUEMA (Quadruple Exponential Moving Average) and QuintEMA (Quintuple Exponential Moving Average) are advanced smoothing techniques that build on traditional exponential moving averages (EMAs). Both offer higher sensitivity to recent price changes than standard EMAs by adding layers of exponential smoothing. These moving averages are particularly useful for traders looking for a more responsive indicator without the noise often present in shorter-period EMAs.
QUEMA (Quadruple Exponential Moving Average)
The QUEMA is calculated by applying the EMA calculation four times in succession. This method smooths out fluctuations in the price data, creating a balance between sensitivity to recent data and resistance to short-term noise.
The mathematical formula for QUEMA is:
QUEMA=4×EMA1−6×EMA2+4×EMA3−EMA4
This formula results in a moving average that is smoother than a triple EMA (TEMA) and provides a better response to price trends without excessive lag.
QuintEMA (Quintuple Exponential Moving Average)
The QuintEMA goes one step further by applying the EMA calculation five times in a row. This level of exponential smoothing is useful for identifying strong, persistent trends while remaining adaptive to recent price shifts.
The QuintEMA is calculated as :
QuintEMA=5×EMA1−10×EMA2+10×EMA3−5×EMA4+EMA5
The additional layer in QuintEMA further reduces the impact of short-term price fluctuations, making it especially useful in strongly trending markets.
The Smart Ribbon V2 combines the benefits of several moving average types to deliver a versatile tool for analyzing market trends, momentum, and potential reversals. With QUEMA and QuintEMA as advanced options, it allows traders to tailor the indicator to match their preferred trading style, whether it involves higher responsiveness or smoother trend visualization. This adaptability makes Smart Ribbon V2 a powerful choice for both novice and experienced traders seeking to improve their trend-following and market analysis strategies.
The Smart Ribbon V2 helps traders:
- Identify Trend Direction
- Gauge Momentum
- Spot Trend Reversals
- Determine Entry and Exit Points
Detailed Explanation of QUEMA and QuintEMA
The QUEMA (Quadruple Exponential Moving Average) and QuintEMA (Quintuple Exponential Moving Average) are advanced smoothing techniques that build on traditional exponential moving averages (EMAs). Both offer higher sensitivity to recent price changes than standard EMAs by adding layers of exponential smoothing. These moving averages are particularly useful for traders looking for a more responsive indicator without the noise often present in shorter-period EMAs.
QUEMA (Quadruple Exponential Moving Average)
The QUEMA is calculated by applying the EMA calculation four times in succession. This method smooths out fluctuations in the price data, creating a balance between sensitivity to recent data and resistance to short-term noise.
The mathematical formula for QUEMA is:
QUEMA=4×EMA1−6×EMA2+4×EMA3−EMA4
This formula results in a moving average that is smoother than a triple EMA (TEMA) and provides a better response to price trends without excessive lag.
QuintEMA (Quintuple Exponential Moving Average)
The QuintEMA goes one step further by applying the EMA calculation five times in a row. This level of exponential smoothing is useful for identifying strong, persistent trends while remaining adaptive to recent price shifts.
The QuintEMA is calculated as :
QuintEMA=5×EMA1−10×EMA2+10×EMA3−5×EMA4+EMA5
The additional layer in QuintEMA further reduces the impact of short-term price fluctuations, making it especially useful in strongly trending markets.
The Smart Ribbon V2 combines the benefits of several moving average types to deliver a versatile tool for analyzing market trends, momentum, and potential reversals. With QUEMA and QuintEMA as advanced options, it allows traders to tailor the indicator to match their preferred trading style, whether it involves higher responsiveness or smoother trend visualization. This adaptability makes Smart Ribbon V2 a powerful choice for both novice and experienced traders seeking to improve their trend-following and market analysis strategies.
Script de código aberto
Em verdadeiro espírito do TradingView, o criador deste script o tornou de código aberto, para que os traders possam revisar e verificar sua funcionalidade. Parabéns ao autor! Embora você possa usá-lo gratuitamente, lembre-se de que a republicação do código está sujeita às nossas Regras da Casa.
Aviso legal
As informações e publicações não se destinam a ser, e não constituem, conselhos ou recomendações financeiras, de investimento, comerciais ou de outro tipo fornecidos ou endossados pela TradingView. Leia mais nos Termos de Uso.