PROTECTED SOURCE SCRIPT
Tolga's Market Radar - Dashboard
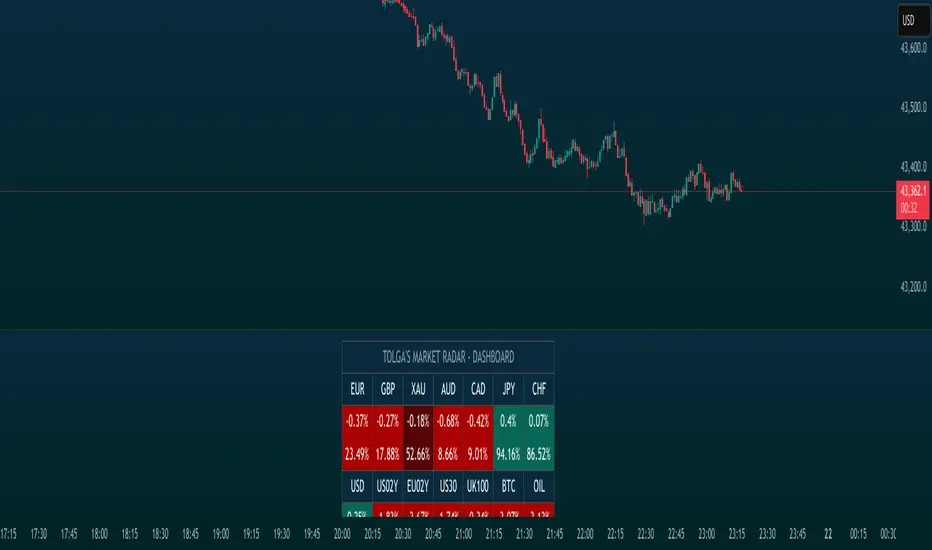
Tolga's Market Radar - Dashboard – The Only TradingView Dashboard Showing Both Daily Performance & Daily Range Together.
This unique dashboard concisely displays both the daily percentage change and the daily range position for up to 14 user-selected tickers, all in one clear, easy-to-follow table.
A customizable dashboard to track daily percentage changes and daily range positions for up to 14 user‐defined symbols. This script displays a color‐coded table (teal for bullish moves, red for bearish moves) that updates in real‐time, helping you quickly gauge market conditions across various assets.
Key Features:
Ideal for traders who want a compact, real-time snapshot of market moves without clutter. Enjoy a streamlined view that uniquely combines both performance and range data in one dashboard!
Two Measurements
Configure Symbols
Interpretation of the Table
Each cell shows two lines:
The background color instantly tells you if the asset is bullish or bearish and whether the close is near the top or bottom of the day’s range.
Notes & Disclaimers:
This unique dashboard concisely displays both the daily percentage change and the daily range position for up to 14 user-selected tickers, all in one clear, easy-to-follow table.
A customizable dashboard to track daily percentage changes and daily range positions for up to 14 user‐defined symbols. This script displays a color‐coded table (teal for bullish moves, red for bearish moves) that updates in real‐time, helping you quickly gauge market conditions across various assets.
Key Features:
- Dual Metrics: Simultaneously shows daily performance (percentage change) and range position.
- Customizable: Set your preferred tickers and labels, with an option to invert for quote-driven pairs.
- Color-Coded Clarity: Uses a teal/red scheme to instantly highlight bullish or bearish moves.
- Flexible Timeframes: Adjust the resolution to suit your trading strategy.
Ideal for traders who want a compact, real-time snapshot of market moves without clutter. Enjoy a streamlined view that uniquely combines both performance and range data in one dashboard!
Two Measurements
- Daily % Change: (Close - Previous Close) / Previous Close × 100.
- Daily Range Position: Where today’s close sits relative to the day’s high/low, expressed as a percentage (0% = at low, 100% = at high).
Configure Symbols
- For each row (Group 1 for the top row, Group 2 for the bottom row), enter:
- Symbol Label: The text you want displayed in the table header.
- Symbol Ticker: The TradingView ticker (e.g., FX:AUDUSD, TVC:USOIL, etc.).
- Invert?: Toggle this on if you want to flip the percentage change (for pairs like USDCAD, turning it into CAD’s perspective).
Interpretation of the Table
Each cell shows two lines:
- Daily % Change (top line).
- Daily Range Position (bottom line).
The background color instantly tells you if the asset is bullish or bearish and whether the close is near the top or bottom of the day’s range.
Notes & Disclaimers:
- This script is designed for informational and educational purposes. Always do your own due diligence before making trading decisions.
- Performance may vary depending on your TradingView plan and the number of tickers you request.
Script protegido
Esse script é publicada como código fechado. No entanto, você pode gerenciar suas escolhas de bate-papo. Por favor, abra suas Configurações do perfil
Aviso legal
As informações e publicações não se destinam a ser, e não constituem, conselhos ou recomendações financeiras, de investimento, comerciais ou de outro tipo fornecidos ou endossados pela TradingView. Leia mais nos Termos de Uso.