PROTECTED SOURCE SCRIPT
Atualizado DSKOLI Table

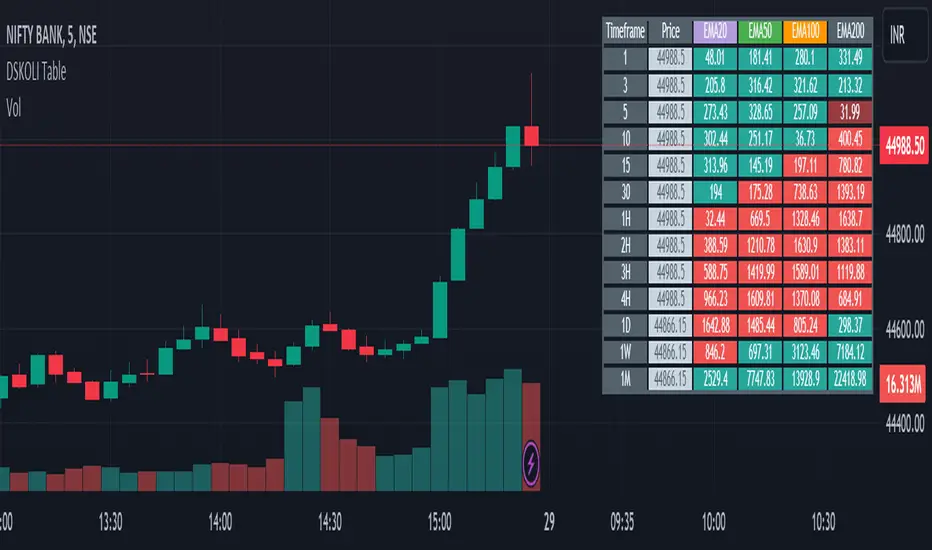
This helps to determine bullish or bearish trend of any chart on any generally available time-frame and good to have for Intraday watch.
Details -
a. Points shown in table shows the difference of last shown price from specified EMAs, this helps to know the price movement of candles are above or below the EMA and its coloured with red and green which even further helps to determine its existing trend.
Note or Disclaimer:
1. This may be considered only for Watching as Learning and informational purpose.
2. Take advice from financial advisor before entering, holding, converting or exiting from any order or trade.
3. Always keep your acceptable stop-loss in all your transactions while trading or investing.
DSKOLI or TradingView reserves all right and don't hold any responsibilities for any loss/losses as well as accuracy of levels or price movement.
Notas de Lançamento
Update.Notas de Lançamento
Update.Notas de Lançamento
Update.Notas de Lançamento
Update.Notas de Lançamento
Update - Labels.Notas de Lançamento
Update.Notas de Lançamento
Update.Notas de Lançamento
Update.Script protegido
Esse script é publicada como código fechado. No entanto, você pode gerenciar suas escolhas de bate-papo. Por favor, abra suas Configurações do perfil
Aviso legal
As informações e publicações não se destinam a ser, e não constituem, conselhos ou recomendações financeiras, de investimento, comerciais ou de outro tipo fornecidos ou endossados pela TradingView. Leia mais nos Termos de Uso.
Script protegido
Esse script é publicada como código fechado. No entanto, você pode gerenciar suas escolhas de bate-papo. Por favor, abra suas Configurações do perfil
Aviso legal
As informações e publicações não se destinam a ser, e não constituem, conselhos ou recomendações financeiras, de investimento, comerciais ou de outro tipo fornecidos ou endossados pela TradingView. Leia mais nos Termos de Uso.