OPEN-SOURCE SCRIPT
Atualizado Logarithmic Bollinger Bands with Secondary Band
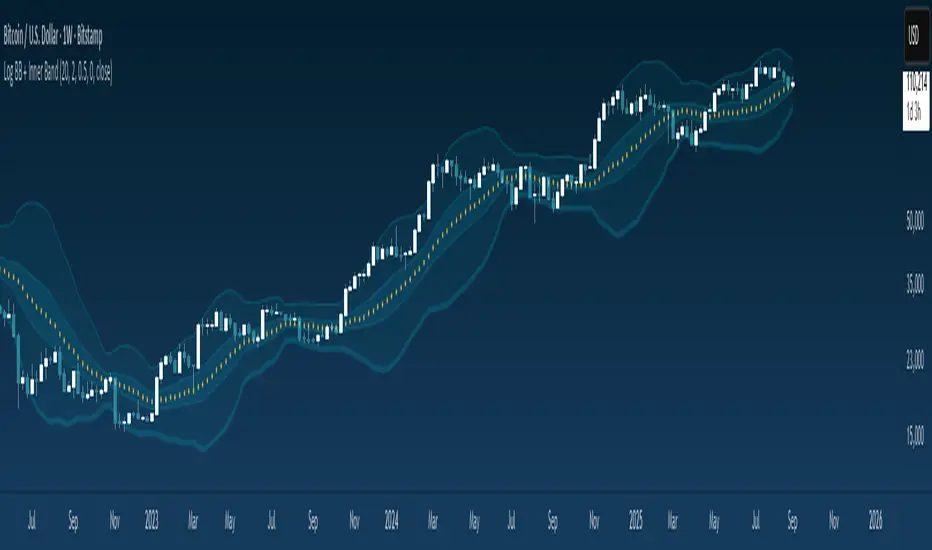
The Logarithmic Bollinger Bands indicator is a variation of standard Bollinger Bands that applies the calculation on a logarithmic scale rather than directly on price values. This approach is particularly useful in markets where assets experience exponential growth or large percentage-based moves, as it allows the bands to adapt proportionally instead of being distorted by absolute price changes. The indicator calculates a moving average of the log-transformed price (the basis), then adds and subtracts multiples of the standard deviation of the log price to form the upper and lower bands. Finally, the results are converted back to normal price scale for plotting. In addition to the primary bands set at 2.0 standard deviations, this version includes a secondary band set at 0.5 standard deviations, offering a closer inner envelope around the mean.
To use this indicator
Traders can observe how price interacts with both the inner and outer bands. The outer 2.0 standard deviation bands represent traditional Bollinger-style boundaries, highlighting potential overbought or oversold conditions when price pushes beyond them.
The inner 0.5 bands provide an earlier signal of price compression and breakout potential, as moves outside these tighter bands often precede larger volatility expansions.
Together, these dual layers give traders a way to monitor both short-term fluctuations and broader trend extremes, making it easier to spot opportunities for entries, exits, or risk management in markets where percentage-based scaling is more meaningful than raw price levels.
Notas de Lançamento
Update colors + stylesScript de código aberto
Em verdadeiro espírito do TradingView, o criador deste script o tornou de código aberto, para que os traders possam revisar e verificar sua funcionalidade. Parabéns ao autor! Embora você possa usá-lo gratuitamente, lembre-se de que a republicação do código está sujeita às nossas Regras da Casa.
Aviso legal
As informações e publicações não se destinam a ser, e não constituem, conselhos ou recomendações financeiras, de investimento, comerciais ou de outro tipo fornecidos ou endossados pela TradingView. Leia mais nos Termos de Uso.
Script de código aberto
Em verdadeiro espírito do TradingView, o criador deste script o tornou de código aberto, para que os traders possam revisar e verificar sua funcionalidade. Parabéns ao autor! Embora você possa usá-lo gratuitamente, lembre-se de que a republicação do código está sujeita às nossas Regras da Casa.
Aviso legal
As informações e publicações não se destinam a ser, e não constituem, conselhos ou recomendações financeiras, de investimento, comerciais ou de outro tipo fornecidos ou endossados pela TradingView. Leia mais nos Termos de Uso.