OPEN-SOURCE SCRIPT
S&R Tracker [CHE]
Dynamic S&R Tracker [CHE]
1. Introduction to the Tool
Purpose:
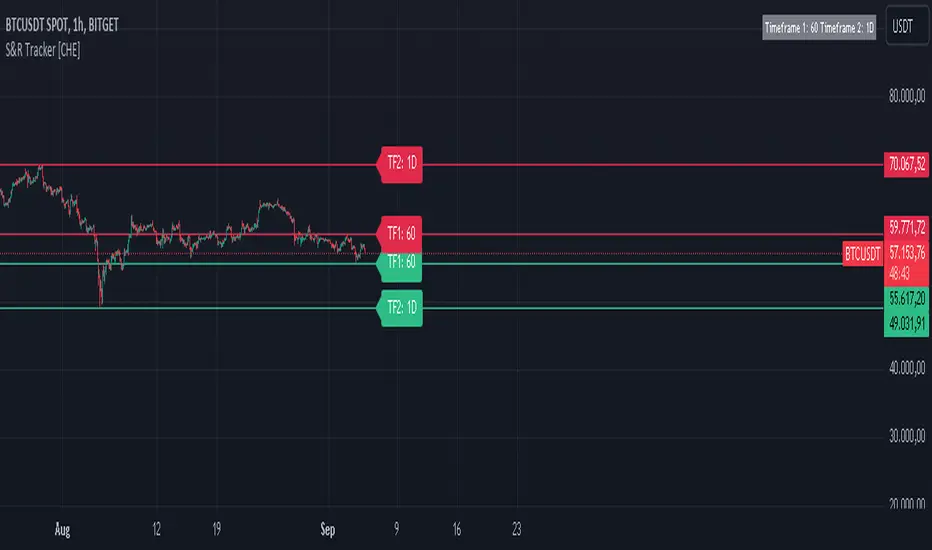
The Dynamic S&R Tracker [CHE] is a powerful TradingView tool designed to automatically detect and display support and resistance levels across multiple timeframes. It dynamically adjusts based on the current chart’s timeframe, making it easier for traders to identify key price levels for both shortterm and longterm analysis.
Key Features:
Dynamic adjustment of support and resistance levels based on realtime market conditions
Simultaneous visualization of support and resistance for two different timeframes
Automatic selection of optimal timeframes for accurate and efficient analysis
2. Functionality
Automatic Timeframe Selection:
The Dynamic S&R Tracker [CHE] uses a smart function to automatically adjust the analysis timeframe based on the market’s current conditions. It selects the appropriate intervals (e.g., 1 hour, 1 day, 1 month) for displaying support and resistance levels, reducing the need for manual intervention.
Support and Resistance Identification:
The tool calculates and identifies key pivot highs and lows, which act as support and resistance levels. These levels are displayed for two timeframes at once, giving a comprehensive view of the market's shortterm and longterm trends.
3. Benefits
Efficiency:
With automatic adjustments, traders save time by not having to manually change timeframes or recalculate levels.
Enhanced Market Insight:
By analyzing two timeframes simultaneously, the tool provides a broader market perspective, helping traders spot potential reversal points and breakouts.
Customizability:
Though dynamic, the Dynamic S&R Tracker [CHE] offers flexibility for manual adjustments, allowing traders to finetune the analysis based on personal preferences or market strategies.
4. Visualization
Support and Resistance Levels:
The tool uses clear visual markers—green for support and red for resistance—making it easy to spot critical price zones on the chart.
Informative Timeframe Display:
The tracker includes a customizable information box that shows the selected timeframes used in the analysis, keeping the user informed at all times.
5. Conclusion
The Dynamic S&R Tracker [CHE] is an essential tool for traders seeking an automated, precise, and flexible way to analyze support and resistance across multiple timeframes. By offering dynamic adjustments and clear visual feedback, it simplifies the decisionmaking process and provides deeper market insights.
Ideal for traders who need a streamlined and adaptable solution to better navigate market trends.
1. Introduction to the Tool
Purpose:
The Dynamic S&R Tracker [CHE] is a powerful TradingView tool designed to automatically detect and display support and resistance levels across multiple timeframes. It dynamically adjusts based on the current chart’s timeframe, making it easier for traders to identify key price levels for both shortterm and longterm analysis.
Key Features:
Dynamic adjustment of support and resistance levels based on realtime market conditions
Simultaneous visualization of support and resistance for two different timeframes
Automatic selection of optimal timeframes for accurate and efficient analysis
2. Functionality
Automatic Timeframe Selection:
The Dynamic S&R Tracker [CHE] uses a smart function to automatically adjust the analysis timeframe based on the market’s current conditions. It selects the appropriate intervals (e.g., 1 hour, 1 day, 1 month) for displaying support and resistance levels, reducing the need for manual intervention.
Support and Resistance Identification:
The tool calculates and identifies key pivot highs and lows, which act as support and resistance levels. These levels are displayed for two timeframes at once, giving a comprehensive view of the market's shortterm and longterm trends.
3. Benefits
Efficiency:
With automatic adjustments, traders save time by not having to manually change timeframes or recalculate levels.
Enhanced Market Insight:
By analyzing two timeframes simultaneously, the tool provides a broader market perspective, helping traders spot potential reversal points and breakouts.
Customizability:
Though dynamic, the Dynamic S&R Tracker [CHE] offers flexibility for manual adjustments, allowing traders to finetune the analysis based on personal preferences or market strategies.
4. Visualization
Support and Resistance Levels:
The tool uses clear visual markers—green for support and red for resistance—making it easy to spot critical price zones on the chart.
Informative Timeframe Display:
The tracker includes a customizable information box that shows the selected timeframes used in the analysis, keeping the user informed at all times.
5. Conclusion
The Dynamic S&R Tracker [CHE] is an essential tool for traders seeking an automated, precise, and flexible way to analyze support and resistance across multiple timeframes. By offering dynamic adjustments and clear visual feedback, it simplifies the decisionmaking process and provides deeper market insights.
Ideal for traders who need a streamlined and adaptable solution to better navigate market trends.
Script de código aberto
Em verdadeiro espírito do TradingView, o criador deste script o tornou de código aberto, para que os traders possam revisar e verificar sua funcionalidade. Parabéns ao autor! Embora você possa usá-lo gratuitamente, lembre-se de que a republicação do código está sujeita às nossas Regras da Casa.
Aviso legal
As informações e publicações não se destinam a ser, e não constituem, conselhos ou recomendações financeiras, de investimento, comerciais ou de outro tipo fornecidos ou endossados pela TradingView. Leia mais nos Termos de Uso.