OPEN-SOURCE SCRIPT
Andean Oscillator (Version 3.0 Sr.K)
Andean Oscillator (Version 3.0 Sr.K)
This indicator is a momentum-based oscillator that measures the balance between bullish and bearish pressure.
🔧 How it works:
It calculates two adaptive envelopes around price and derives a "bullish" and "bearish" component.
The oscillator value is simply Bull - Bear, showing which side dominates.
A signal line (EMA of the oscillator) smooths the raw value.
Optionally, ±1σ levels are plotted to highlight statistically strong moves.
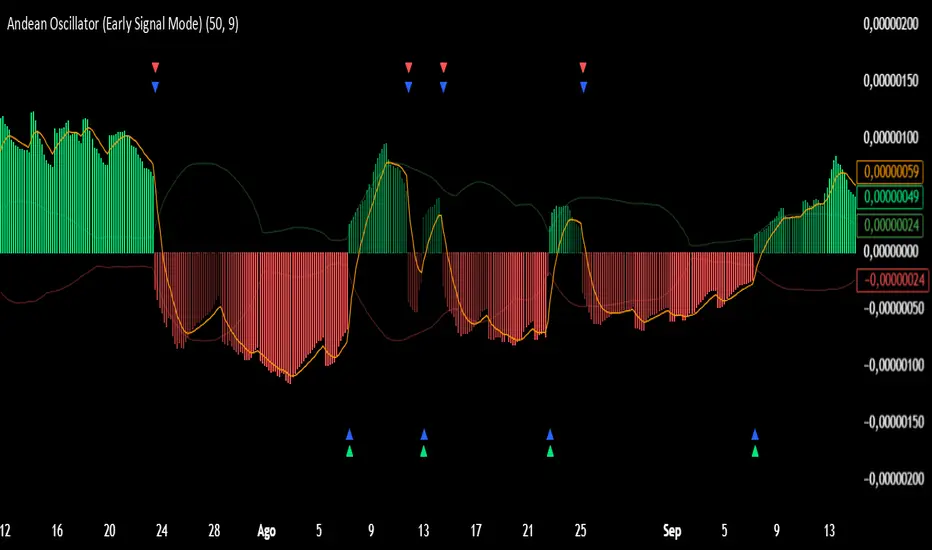
📊 What you see:
Histogram: Positive bars = bullish momentum, negative bars = bearish.
Orange Line: Signal line (EMA) used to confirm or anticipate reversals.
Zero Line: The equilibrium point. Crosses of this level signal a shift in market bias.
Green / Red Triangles: Buy and sell signals, either when crossing zero or crossing the signal line (depending on selected mode).
⚡ Early Signal Mode:
When enabled, signals trigger earlier — at the crossover between the oscillator and its signal line — allowing traders to enter potential reversals before a full zero-cross confirmation.
✅ Use cases:
Identify momentum shifts before price reversals.
Spot potential long/short setups with reduced lag.
Combine with price action or support/resistance for confirmation.
⚠️ Note: This is a tool for discretionary/manual trading. It does not open or close trades automatically. Always confirm with your own analysis and risk management.
This indicator is a momentum-based oscillator that measures the balance between bullish and bearish pressure.
🔧 How it works:
It calculates two adaptive envelopes around price and derives a "bullish" and "bearish" component.
The oscillator value is simply Bull - Bear, showing which side dominates.
A signal line (EMA of the oscillator) smooths the raw value.
Optionally, ±1σ levels are plotted to highlight statistically strong moves.
📊 What you see:
Histogram: Positive bars = bullish momentum, negative bars = bearish.
Orange Line: Signal line (EMA) used to confirm or anticipate reversals.
Zero Line: The equilibrium point. Crosses of this level signal a shift in market bias.
Green / Red Triangles: Buy and sell signals, either when crossing zero or crossing the signal line (depending on selected mode).
⚡ Early Signal Mode:
When enabled, signals trigger earlier — at the crossover between the oscillator and its signal line — allowing traders to enter potential reversals before a full zero-cross confirmation.
✅ Use cases:
Identify momentum shifts before price reversals.
Spot potential long/short setups with reduced lag.
Combine with price action or support/resistance for confirmation.
⚠️ Note: This is a tool for discretionary/manual trading. It does not open or close trades automatically. Always confirm with your own analysis and risk management.
Script de código aberto
Em verdadeiro espírito do TradingView, o criador deste script o tornou de código aberto, para que os traders possam revisar e verificar sua funcionalidade. Parabéns ao autor! Embora você possa usá-lo gratuitamente, lembre-se de que a republicação do código está sujeita às nossas Regras da Casa.
Aviso legal
As informações e publicações não se destinam a ser, e não constituem, conselhos ou recomendações financeiras, de investimento, comerciais ou de outro tipo fornecidos ou endossados pela TradingView. Leia mais nos Termos de Uso.