OPEN-SOURCE SCRIPT
Orion:Supertrend Hybrid
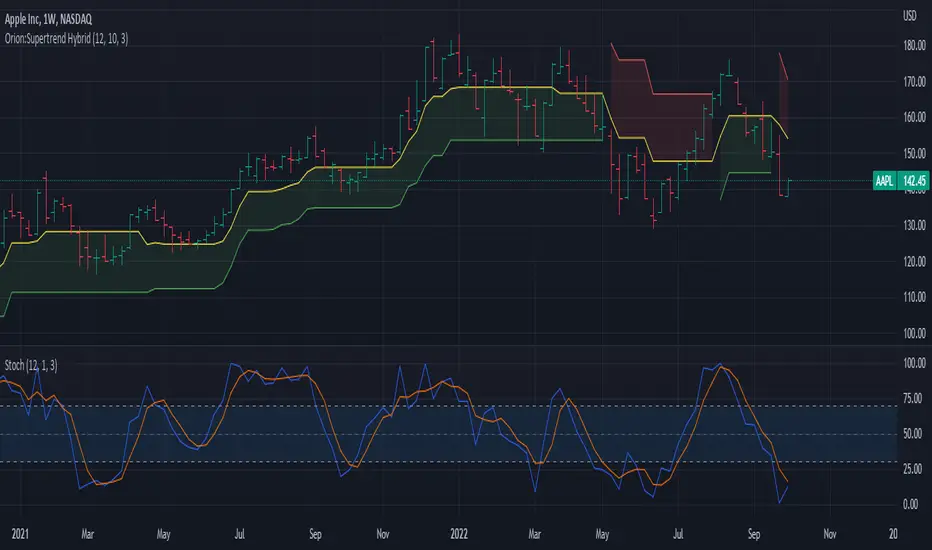
Supertrend Hybrid
This indicator is a combination of the Supertrend and Donchian Channels.
The original Supertrend indicator shades the area from the mean (hl2) of the bar/candle to the Supertrend line.
This Hybrid uses the mid section of the Donchian channel to the Supertrend line as the area to be shaded.
This provides a visual of when prices are getting close to potentially reversing the trend.
Values:
Length = Length of the Donchian Channels (Default: 12)
ATR Length = Lookback length of the ATR calculation (Default: 10)
Factor = Multiply the ATR by this value to get a trend reversal value (Default: 3.0)
Prices cross above the red line indicating a bullish trend is in play
Prices cross below the green line indicating a bearish trend is in play
Yellow line represents the mid-section of the Donchian Channel.
Suggested usage:
Add a Stochastic and set the Stochastic %K Length to the same value as the Donchian Length.
When below trend (red line dominate) and prices cross into the shaded area, if stochastic crosses above 70, prices may challenge/cross the red trend line.
When above trend (green line dominate) and prices cross into the shaded area, if stochastic crosses below 30, prices may challenge/cross the green trend line.
IF in an up trend (green line dominate) and stochastic crosses/remains above 70, potential higher price movement exists.
IF in an down trend (red line dominate) and stochastic crosses/remains below 30, potential lower price movement exists.
Script de código aberto
Em verdadeiro espírito do TradingView, o criador deste script o tornou de código aberto, para que os traders possam revisar e verificar sua funcionalidade. Parabéns ao autor! Embora você possa usá-lo gratuitamente, lembre-se de que a republicação do código está sujeita às nossas Regras da Casa.
Aviso legal
The information and publications are not meant to be, and do not constitute, financial, investment, trading, or other types of advice or recommendations supplied or endorsed by TradingView. Read more in the Terms of Use.