OPEN-SOURCE SCRIPT
Different Donchian Periods
Hi!
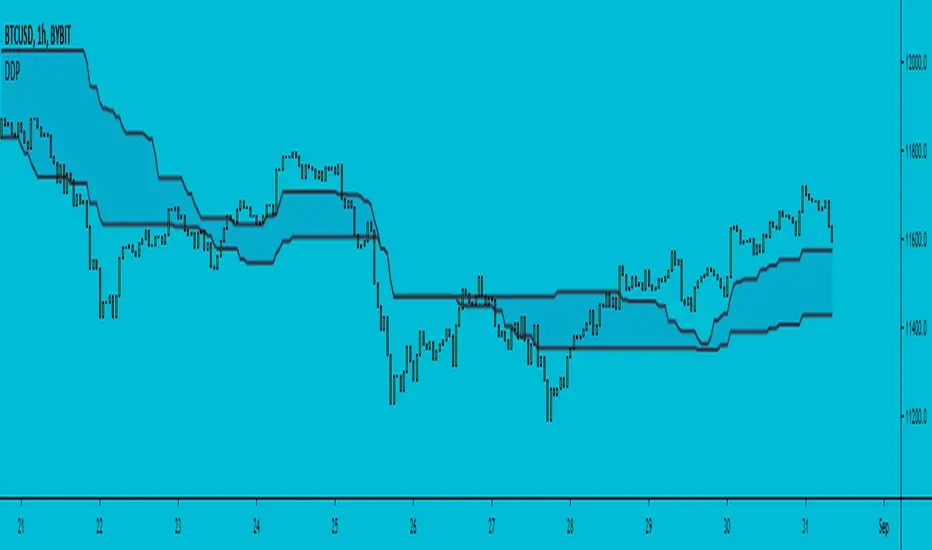
This is a very simple script that I couldn't find on TradingView yet. Look at this indicator how you want (band, cloud, ma's) and create your own settings, I did not test it.
Normally, Donchian average calculates the average(middle) of the highest point of a given period and the lowest point of that same period.
Here I use two separate periods, one for highest, a different one for lowest. That's it :)
Let me know if it's useful to you, I appreciate your comments.
Script de código aberto
Em verdadeiro espírito do TradingView, o criador deste script o tornou de código aberto, para que os traders possam revisar e verificar sua funcionalidade. Parabéns ao autor! Embora você possa usá-lo gratuitamente, lembre-se de que a republicação do código está sujeita às nossas Regras da Casa.
Aviso legal
As informações e publicações não se destinam a ser, e não constituem, conselhos ou recomendações financeiras, de investimento, comerciais ou de outro tipo fornecidos ou endossados pela TradingView. Leia mais nos Termos de Uso.