OPEN-SOURCE SCRIPT
Atualizado Follow Trend - Wall Street Strategy
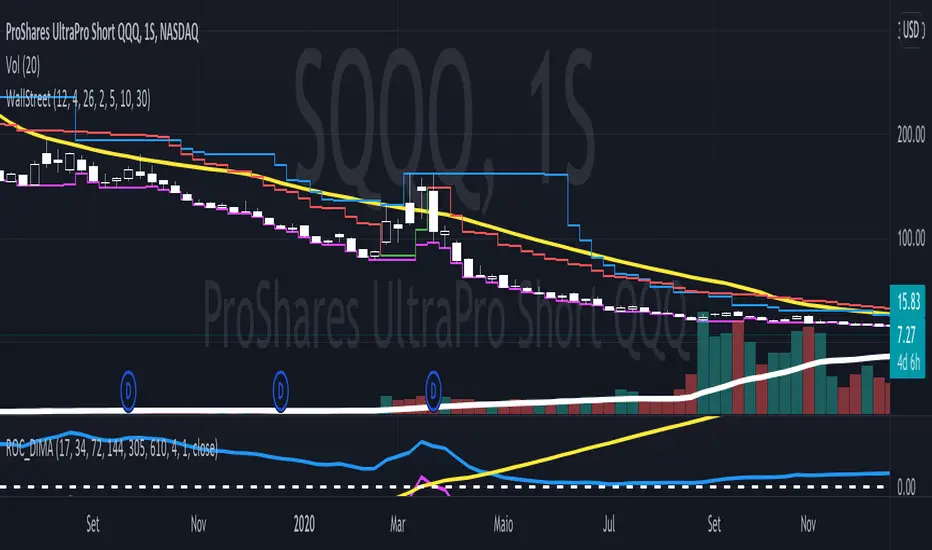
It is a mix of three common indicators, they are The High band level of Donchian Channel, 6 emas (17, 34, 72, 144, 200 and 305), and 2 VStop with different multipliers.
We search stocks are going higher and higher each time. So we look at the High-level Donchian band and if the price made a little correction and didn't touch the VStop indicator and, the price is higher than all the ema's. So we try to buy the stocks when it pass through the last highest price.
The Vstop-short we use to stocks and commodities.
The VStop-long, we use to Bonds and Reits.
In order to help, there is a triangle when the price crossover any VStop, at least the half of Donchian period.
Notas de Lançamento
I forgot one of the ema'sNotas de Lançamento
There are some other possibilities about crossing price and VStop-short and VStop-long that I was forgot. Now it is complete!Notas de Lançamento
Some wrong indication on it touch the VStopNotas de Lançamento
EMA's change color to green when the price is upper than ema's and they are red when the price is lower than they.Notas de Lançamento
1 -I put the correct name of each ema in plot and now they are the same at the user display2- All the important values are showing at the end . There is a resume of our strategy, Its show the start price (the highest value + 0.01), the short-stop value, the long-stop value and its brings if all the price is higher then all ema's ploted. If one of the ema's is above the price, it will show the ema's problem and don;t shows the our strategy value.
Notas de Lançamento
Legend text now is white, not black.Notas de Lançamento
User can choose DarkTheme or LightTheme on the legendsNotas de Lançamento
Now its show the relation risc vs return at each ATRNotas de Lançamento
In some stocks, we don't have enough data to calculate large ema's, so in these cases, the strategy shows Ema's Bad but it isn't true. we don't have enough data to calculate it. In those cases, we will ignore them. When the close price was below ema our script says it was bad, but it isn't true either. It is irrelevant for our strategy because the price along the week was above the ema, so now we calculate the ema using the high price along the week.
Notas de Lançamento
I changed some indicators colors. I added dashed extend lines to show here are the vstop, vstop2 and buyprice.Notas de Lançamento
DarkTheme is working nowSubtract some indicators that we didn't use anymore.
Now is more simply. They are project to weekly graphcs.
Notas de Lançamento
Correction on value of Donchian BottomNotas de Lançamento
Change Colors on Donchian Bottom and EMA2Notas de Lançamento
Change Line StylesNotas de Lançamento
The Vstop line has two color. When the vstop price is less than close price the line will be green and when the vstop price is higher then close price it will be red.Script de código aberto
Em verdadeiro espírito do TradingView, o criador deste script o tornou de código aberto, para que os traders possam revisar e verificar sua funcionalidade. Parabéns ao autor! Embora você possa usá-lo gratuitamente, lembre-se de que a republicação do código está sujeita às nossas Regras da Casa.
Aviso legal
As informações e publicações não se destinam a ser, e não constituem, conselhos ou recomendações financeiras, de investimento, comerciais ou de outro tipo fornecidos ou endossados pela TradingView. Leia mais nos Termos de Uso.
Script de código aberto
Em verdadeiro espírito do TradingView, o criador deste script o tornou de código aberto, para que os traders possam revisar e verificar sua funcionalidade. Parabéns ao autor! Embora você possa usá-lo gratuitamente, lembre-se de que a republicação do código está sujeita às nossas Regras da Casa.
Aviso legal
As informações e publicações não se destinam a ser, e não constituem, conselhos ou recomendações financeiras, de investimento, comerciais ou de outro tipo fornecidos ou endossados pela TradingView. Leia mais nos Termos de Uso.