CandelaCharts - ATH Drawdown
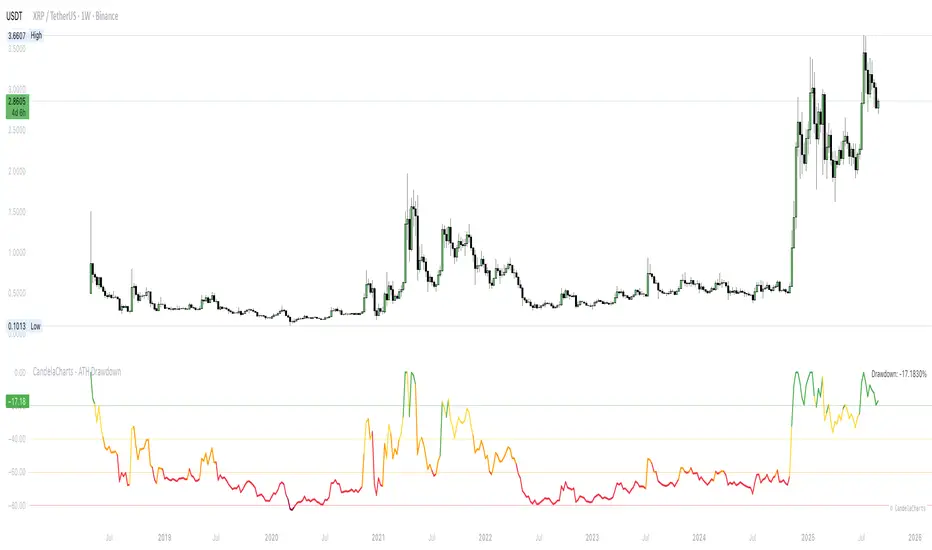
Track how far price is from its All-Time High (ATH) at any moment. This tool plots the percentage drawdown since the running ATH, so you instantly see whether the market is near peak (≈0%) or deep in a cycle reset (e.g., −60% to −80%). It’s designed for cycle analysis, risk framing, DCA planning, and spotting “capitulation” zones across any symbol or timeframe.
📦 Features
- True ATH drawdown% — 0% at ATH; negative values show distance below ATH.
- Price source switch — choose Close or High (wick-based ATH).
- Optional smoothing — EMA on drawdown% for cleaner cycles.
- Color-coded risk bands — green → yellow → orange → red → maroon as drawdown deepens.
- Milestone gridlines — quick read at −20/−40/−60/−80%.
- Inline readout — compact table shows the latest drawdown%.
- Ready-made alert — notify when drawdown enters the classic −70% to −80% zone.
⚙️ Settings
- Price — [code]Close[/code] or [code]High[/code] for ATH calculation (wicks vs closes).
Smoothing — EMA length on drawdown% (0 = off).
Show grid lines — level guides at −20/−40/−60/−80%.
Alert 70–80% — enable alert when drawdown is between −70% and −80%.
Show latest ATH drawdown % — table readout in the chart.
⚡️ Showcase
Contextualize cycle risk: near 0% = late-cycle/expansion; sub −60% = deep retrace.
📒 Usage
- Add to any symbol/timeframe.
- Pick Price source (Close or High) to match your methodology.
- (Optional) Set Smoothing to clarify bigger cycles.
- Use color bands & gridlines to define risk buckets (e.g., “accumulate < −60%”).
- Watch the table for the current drawdown at a glance.
🚨 Alerts
The indicator provides configurable alerts that turn drawdown bands into actionable signals.
Drawdown between 70% and 80% — fires when drawdown enters the −70%…−80% band; ideal for “capitulation zone” notifications.
⚠️ Disclaimer
These tools are exclusively available on the TradingView platform.
Our charting tools are intended solely for informational and educational purposes and should not be regarded as financial, investment, or trading advice. They are not designed to predict market movements or offer specific recommendations. Users should be aware that past performance is not indicative of future results and should not rely on these tools for financial decisions. By using these charting tools, the purchaser agrees that the seller and creator hold no responsibility for any decisions made based on information provided by the tools. The purchaser assumes full responsibility and liability for any actions taken and their consequences, including potential financial losses or investment outcomes that may result from the use of these products.
By purchasing, the customer acknowledges and accepts that neither the seller nor the creator is liable for any undesired outcomes stemming from the development, sale, or use of these products. Additionally, the purchaser agrees to indemnify the seller from any liability. If invited through the Friends and Family Program, the purchaser understands that any provided discount code applies only to the initial purchase of Candela's subscription. The purchaser is responsible for canceling or requesting cancellation of their subscription if they choose not to continue at the full retail price. In the event the purchaser no longer wishes to use the products, they must unsubscribe from the membership service, if applicable.
We do not offer reimbursements, refunds, or chargebacks. Once these Terms are accepted at the time of purchase, no reimbursements, refunds, or chargebacks will be issued under any circumstances.
By continuing to use these charting tools, the user confirms their understanding and acceptance of these Terms as outlined in this disclaimer.
Script sob convite
Somente usuários aprovados pelo autor podem acessar este script. Você precisará solicitar e obter permissão para usá-lo. Normalmente, essa permissão é concedida após o pagamento. Para obter mais detalhes, siga as instruções do autor abaixo ou entre em contato diretamente com CandelaCharts.
O TradingView NÃO recomenda pagar ou usar um script ao não ser que você confie totalmente no seu autor e compreende como isso funciona. Você pode também encontrar alternativas gratuitas e de código aberto em nossa comunidade de scripts.
Instruções do autor
Aviso: leia nosso guia para scritps somente sob convite antes de solicitar acesso.
Join our community: discord.gg/etGSTepqbu
All content provided by CandelaCharts is for informational & educational purposes only.
Aviso legal
Script sob convite
Somente usuários aprovados pelo autor podem acessar este script. Você precisará solicitar e obter permissão para usá-lo. Normalmente, essa permissão é concedida após o pagamento. Para obter mais detalhes, siga as instruções do autor abaixo ou entre em contato diretamente com CandelaCharts.
O TradingView NÃO recomenda pagar ou usar um script ao não ser que você confie totalmente no seu autor e compreende como isso funciona. Você pode também encontrar alternativas gratuitas e de código aberto em nossa comunidade de scripts.
Instruções do autor
Aviso: leia nosso guia para scritps somente sob convite antes de solicitar acesso.
Join our community: discord.gg/etGSTepqbu
All content provided by CandelaCharts is for informational & educational purposes only.