PROTECTED SOURCE SCRIPT
Atualizado Percent up to ATH v. 2.0 (CHECK 1D TIMEFRAME)
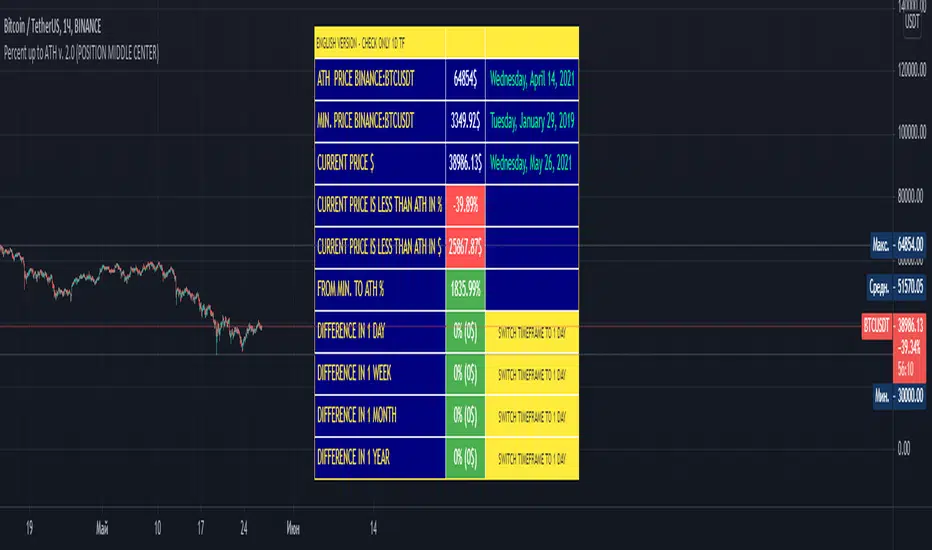
for the label to display the price change for 1 day, 1 week, 1 month and 1 year, you must switch the graph to the daily (1D) timeframe
this script shows:
- the maximum price and the date of this maximum
- the minimum price and date of this minimum
- current price and date of this price
- the difference between the current price and the maximum price in percent (%) and in dollars ($)
- the difference between the minimum price and the maximum price in percent (%) and in dollars ($)
- price change in percent and dollars for 1 day, 1 week, 1 month and 1 year
this script displays information in two languages - English and Russian

---------------------------------------------------------------------------------------------------------------------------------------------------------------------------------------------------------------
Чтобы на метке отображалось изменение цены за 1 день, 1 неделю, 1 месяц и 1 год, необходимо переключить график на дневной (1D) таймфрейм
этот скрипт показывает:
- максимальную цена и дату этого максимума
- минимальную цена и дату этого минимума
- текущую цена и дату этой цены
- разница между текущей ценой и максимальной ценой в процентах (%) и в долларах ($)
- разница между минимальной ценой и максимальной ценой в процентах (%) и в долларах ($)
- изменение цены в процентах и долларах за 1 день, 1 неделю, 1 месяц и 1 год
этот скрипт отображает информацию на двух языках - английском и русском.

this script shows:
- the maximum price and the date of this maximum
- the minimum price and date of this minimum
- current price and date of this price
- the difference between the current price and the maximum price in percent (%) and in dollars ($)
- the difference between the minimum price and the maximum price in percent (%) and in dollars ($)
- price change in percent and dollars for 1 day, 1 week, 1 month and 1 year
this script displays information in two languages - English and Russian
---------------------------------------------------------------------------------------------------------------------------------------------------------------------------------------------------------------
Чтобы на метке отображалось изменение цены за 1 день, 1 неделю, 1 месяц и 1 год, необходимо переключить график на дневной (1D) таймфрейм
этот скрипт показывает:
- максимальную цена и дату этого максимума
- минимальную цена и дату этого минимума
- текущую цена и дату этой цены
- разница между текущей ценой и максимальной ценой в процентах (%) и в долларах ($)
- разница между минимальной ценой и максимальной ценой в процентах (%) и в долларах ($)
- изменение цены в процентах и долларах за 1 день, 1 неделю, 1 месяц и 1 год
этот скрипт отображает информацию на двух языках - английском и русском.
Notas de Lançamento
[ENG]In this version I added a position selection for the label. As well as notification about if the daily timeframe is not enabled
-------------------------------------------------------------------------
[RUS]
В этой версии я добавил выбор позиции для метки. А так же оповещание о том , если не включен дневной таймфрейм
Script protegido
Esse script é publicada como código fechado. No entanto, você pode gerenciar suas escolhas de bate-papo. Por favor, abra suas Configurações do perfil
Aviso legal
As informações e publicações não se destinam a ser, e não constituem, conselhos ou recomendações financeiras, de investimento, comerciais ou de outro tipo fornecidos ou endossados pela TradingView. Leia mais nos Termos de Uso.