Zeta Breakout
But who creates Demand & Supply? You or Me, the retailers? No. It is Big Institutions and Mutual Funds and Big Banks which create this demand and supply because the
share of retailers in Stock Market is so little it does not affect the price in a big way.
The Big Institutions, Mutual Funds, Big Banks or in some cases Governments, are collectively called Smart Money.
When Smart Money steps in, the previous levels of Support or Resistance are broken and then the up or down move starts which most probably goes a certain distance.
Now the Support or Resistance levels are not static, they are dynamic in nature and keep changing with the time.
How does this indicator work?
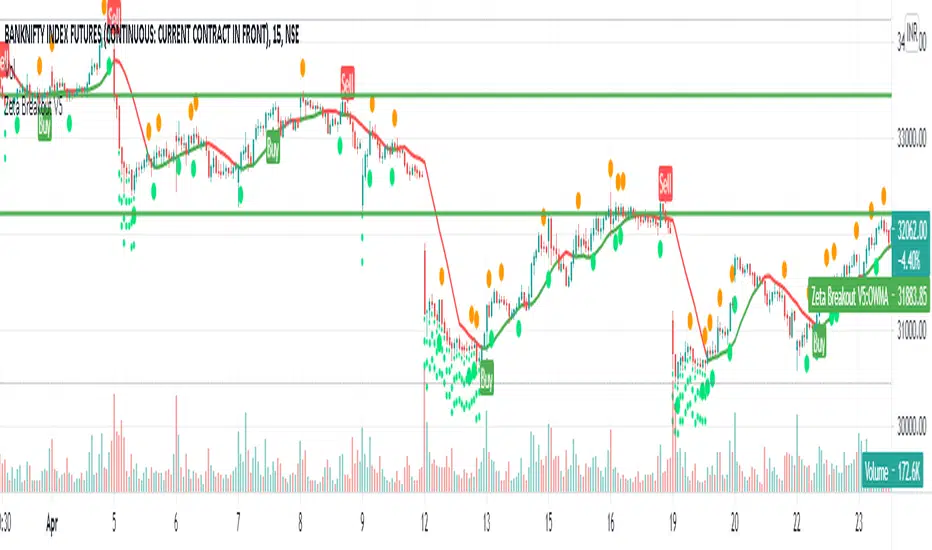
Zeta Breakout dynamically and automatically detects and marks these levels and when the price break-outs or break-downs or bounces up or down from these levels, the Buy or Sell Signals are generated for you to follow.
The indicator keeps watching previous or newly created levels of Support or Resistance and as soon as price crosses these levels or bounces from these levels, the user is alerted in the form of 'Buy' or 'Sell' Signals.
How to use this indicator?
1. When you see a Buy Signal, take Buy Position and hold it till either (a) You see opposite signal or (b) Your Stop Loss is hit which is ideally the low of candle preceding the signal candle or any other user defined SL. If your stop loss is hit and then price again starts moving in the same direction as indicated by the last Buy signal, take a fresh position as soon as the price crosses the level where previous signal is sitting.
2. When you see a Sell Signal, close your Buy Position, take a Sell position and hold it till either (a) You see opposite signal or (b) Your Stop Loss is hit which is ideally the high of candle preceding the signal candle or any user defined SL. If your stop loss is hit and then price again starts moving in the same direction as indicated by the last Sell signal, take a fresh position as soon as the price crosses the level where previous signal is sitting.
What are the target instruments/markets for this indicator?
This indicator can be used on Stocks, Indices, Gold , Silver , Currency Pairs, Crude Oil or anything being trades on any exchange in the world.
This indicator is not limited to any specific time-frame. You may select any time-frame which suits your trading style.
How can you get this indicator?
This is an invite-only paid indicator but we can give you FREE TRIAL for 05 days if you are interested.
For Free Trial, send a message to jellygill
Script sob convite
Somente usuários aprovados pelo autor podem acessar este script. Você precisará solicitar e obter permissão para usá-lo. Normalmente, essa permissão é concedida após o pagamento. Para obter mais detalhes, siga as instruções do autor abaixo ou entre em contato diretamente com jellygill.
A TradingView NÃO recomenda pagar ou usar um script, a menos que você confie totalmente em seu autor e entenda como ele funciona. Você também pode encontrar alternativas gratuitas e de código aberto em nossos scripts da comunidade.
Instruções do autor
Telegram: @jellygill
Our Telegram Channel: @CheetaTrader
join to complete FREE TRAINING on how to use the indicators effectively and then request @jellygill for FREE TRIAL
Aviso legal
Script sob convite
Somente usuários aprovados pelo autor podem acessar este script. Você precisará solicitar e obter permissão para usá-lo. Normalmente, essa permissão é concedida após o pagamento. Para obter mais detalhes, siga as instruções do autor abaixo ou entre em contato diretamente com jellygill.
A TradingView NÃO recomenda pagar ou usar um script, a menos que você confie totalmente em seu autor e entenda como ele funciona. Você também pode encontrar alternativas gratuitas e de código aberto em nossos scripts da comunidade.
Instruções do autor
Telegram: @jellygill
Our Telegram Channel: @CheetaTrader
join to complete FREE TRAINING on how to use the indicators effectively and then request @jellygill for FREE TRIAL