PROTECTED SOURCE SCRIPT
Atualizado 4-EMA Trend
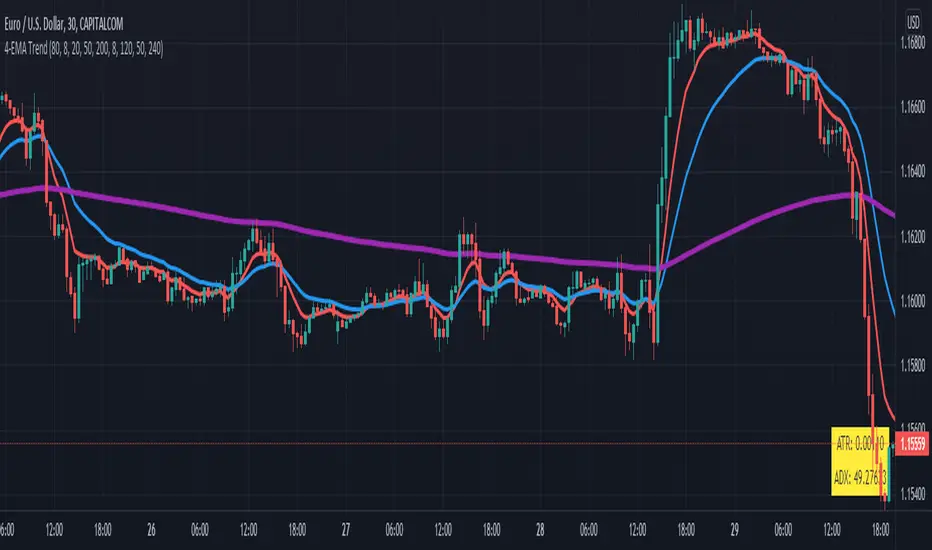
This indicator can be used to visualize when price is above or below special exponential moving averages (8, 21, 50 and 200) that are also displayed on the chart. A green or red background is plotted then, that can be followed as a trend. You can define the amount of risk (e.g. in $) and the number of previous bars that will be used to calculate the stop loss. For the stop loss a label is shown (long or short) that displays the quantity to buy or sell for your defined risk. It is recommend to use the indicator in combination with my Stochastic & RSI (see chart) to enter trades long or short when stochastic is overbought or oversold and RSI above or below 50.
 US100
US100
Notas de Lançamento
Update trend indication: ema8 has to be above / below slower emaNotas de Lançamento
EMA description and length adjustedNotas de Lançamento
Show stop loss buy or sell depending price above or below slowest EMANotas de Lançamento
SMA 40 added as special pullback indicatorNotas de Lançamento
Added alerts for long or short trend changeNotas de Lançamento
Add MTF support for slow EMAsNotas de Lançamento
SMA replaced by EMA for trend detectionNotas de Lançamento
Length of EMAs can be setNotas de Lançamento
MTF EMA not displayed by default, 20, 50, 200 ema default lengthNotas de Lançamento
ATR Stop added as dots (bullish, bearish)Notas de Lançamento
Input option for ema fast and middle lengthNotas de Lançamento
EMA Ribbon added with option to hide itNotas de Lançamento
Alert when price is close to trend EMA (default 200 EMA)Notas de Lançamento
Performance improved, ema ribbon removedNotas de Lançamento
TEMA for trend includedNotas de Lançamento
TEMA with custom length, pine version 5Notas de Lançamento
Refactoring and 4th ema addedNotas de Lançamento
ATR stoploss multiplier addedNotas de Lançamento
Added real price display for Heikin Ashi chart typeNotas de Lançamento
Labels for engulfing candles addedNotas de Lançamento
Engulfing pattern bug fixedNotas de Lançamento
Barcolor for engulfing addedNotas de Lançamento
Engulging candles added and atr to 10Notas de Lançamento
Volatility Stop Length addedNotas de Lançamento
Inside bar added as candlestick patternNotas de Lançamento
Inside bar without colorScript protegido
Esse script é publicada como código fechado. No entanto, você pode gerenciar suas escolhas de bate-papo. Por favor, abra suas Configurações do perfil
Access our indicators from: indivisionx.com
Aviso legal
As informações e publicações não se destinam a ser, e não constituem, conselhos ou recomendações financeiras, de investimento, comerciais ou de outro tipo fornecidos ou endossados pela TradingView. Leia mais nos Termos de Uso.
Script protegido
Esse script é publicada como código fechado. No entanto, você pode gerenciar suas escolhas de bate-papo. Por favor, abra suas Configurações do perfil
Access our indicators from: indivisionx.com
Aviso legal
As informações e publicações não se destinam a ser, e não constituem, conselhos ou recomendações financeiras, de investimento, comerciais ou de outro tipo fornecidos ou endossados pela TradingView. Leia mais nos Termos de Uso.