OPEN-SOURCE SCRIPT
SP 500 PE Ratio (Loose Date Match)
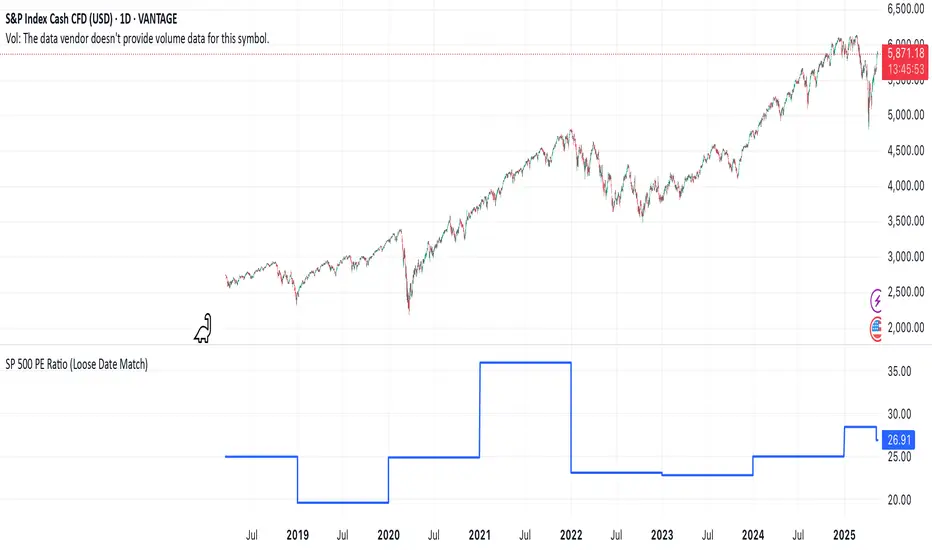
📈 **S&P 500 PE Ratio (from Excel Data)**
This custom indicator visualizes the historical S&P 500 Price-to-Earnings (PE) Ratio loaded from Excel. Each data point represents a snapshot of the market valuation at a specific time, typically on an annual or quarterly basis.
🔹 **What it does:**
- Plots the PE ratio values on the chart aligned with historical dates
- Uses stepwise or linear rendering to account for missing trading days
- Helps identify valuation cycles and extremes (e.g., overvalued vs undervalued)
🔍 **Use case:**
- Long-term market analysis
- Compare PE trends with price performance
- Spot long-term entry/exit zones based on valuation
🛠️ Future plans:
- Add value zone highlighting (e.g., PE > 30 = red, PE < 15 = green)
- Support for dynamic datasets (via Google Sheets or Notion)
Category: `Breadth indicators`, `Cycles`
💡 Source: Manually imported data (can be replaced with any custom macro data series)
Script de código aberto
Em verdadeiro espírito do TradingView, o criador deste script o tornou de código aberto, para que os traders possam revisar e verificar sua funcionalidade. Parabéns ao autor! Embora você possa usá-lo gratuitamente, lembre-se de que a republicação do código está sujeita às nossas Regras da Casa.
Aviso legal
As informações e publicações não se destinam a ser, e não constituem, conselhos ou recomendações financeiras, de investimento, comerciais ou de outro tipo fornecidos ou endossados pela TradingView. Leia mais nos Termos de Uso.