PROTECTED SOURCE SCRIPT
Px & Vol Up/Dn Ratio with MA
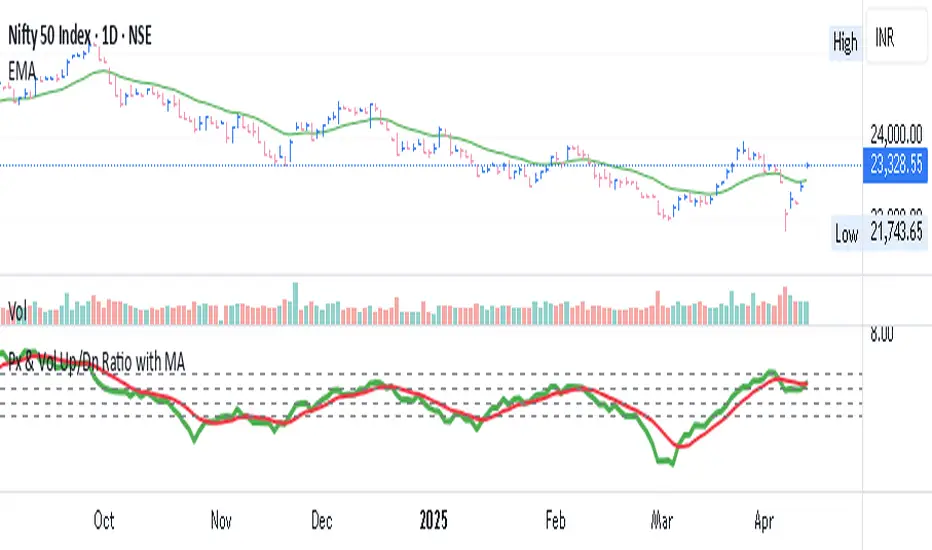
Px & Vol Up/Down Ratio with Moving Average
This custom indicator calculates the Price Up/Down Ratio and Volume Up/Down Ratio over a user-defined lookback period. It provides a unique perspective on market strength by comparing the magnitude of gains vs. losses (in both price and volume) — helping traders gauge the underlying momentum and accumulation/distribution behavior.
🔍 Core Features:
Price Ratio: Total positive price change divided by the absolute value of total negative price change.
Volume Ratio: Total volume on up days divided by total volume on down days.
Moving Average Overlay: Smooth each ratio with your choice of moving average — SMA, EMA, or WMA.
Customizable lookback period and moving average length for flexible analysis.
🧭 Use Case:
A rising Price Ratio above 1 indicates stronger positive price action than negative.
A rising Volume Ratio above 1 suggests increased participation on up moves — a sign of accumulation.
Divergences between Price and Volume ratios can provide early clues on trend reversals or weakening momentum.
🧱 Visual Aids:
Includes six key horizontal reference lines at levels: 0.5, 0.75, 1, 1.25, 1.5, 2 to benchmark current ratio strength.
Color-coded plots for clarity:
Blue for Price Ratio
Green for Volume Ratio
Script protegido
Esse script é publicada como código fechado. No entanto, você pode gerenciar suas escolhas de bate-papo. Por favor, abra suas Configurações do perfil
Aviso legal
As informações e publicações não se destinam a ser, e não constituem, conselhos ou recomendações financeiras, de investimento, comerciais ou de outro tipo fornecidos ou endossados pela TradingView. Leia mais nos Termos de Uso.