PROTECTED SOURCE SCRIPT
GFM Analyst 01 - Price Action & EMAs
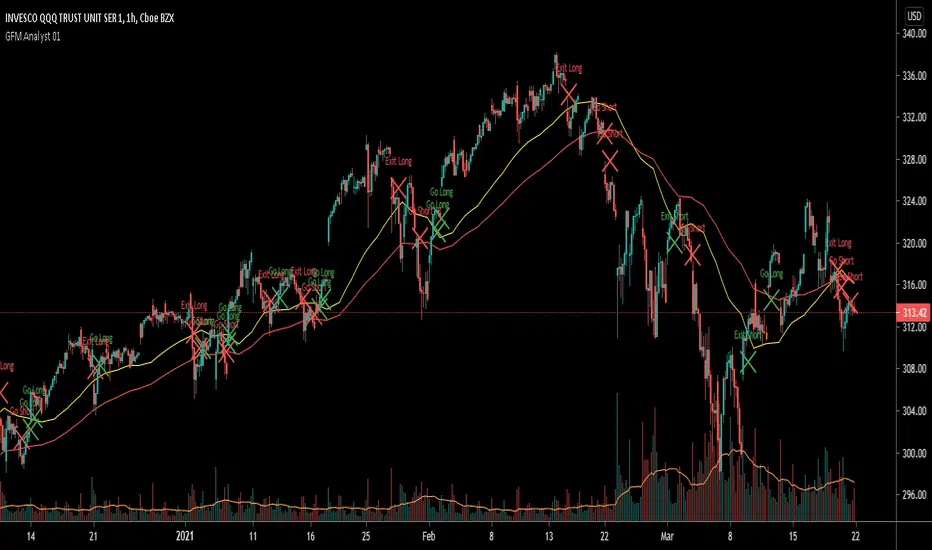
This indicator will help in identifying trends. It is using the historic price action to determine the Buy and Sell signals.
Also we have used the Exponential Moving Averages on a daily timeframe (resolution/period). This will help is eradicate any false signals.
Yellow Line = Fast Exponential Moving Average
Red Line = Slow Exponential Moving Average
On a shorter timeframe, one should ignore short signals, if the price is moving above these two EMA's and similarly ignore long signals, if the price is moving below these two EMA's.
Script protegido
Esse script é publicada como código fechado. No entanto, você pode gerenciar suas escolhas de bate-papo. Por favor, abra suas Configurações do perfil
Aviso legal
As informações e publicações não se destinam a ser, e não constituem, conselhos ou recomendações financeiras, de investimento, comerciais ou de outro tipo fornecidos ou endossados pela TradingView. Leia mais nos Termos de Uso.