PROTECTED SOURCE SCRIPT
VR1 DEMA
Sure, here's a description for the "Volume Range Dual EMA" indicator:
---
**Indicator Name:** Volume Range Dual EMA
**Description:**
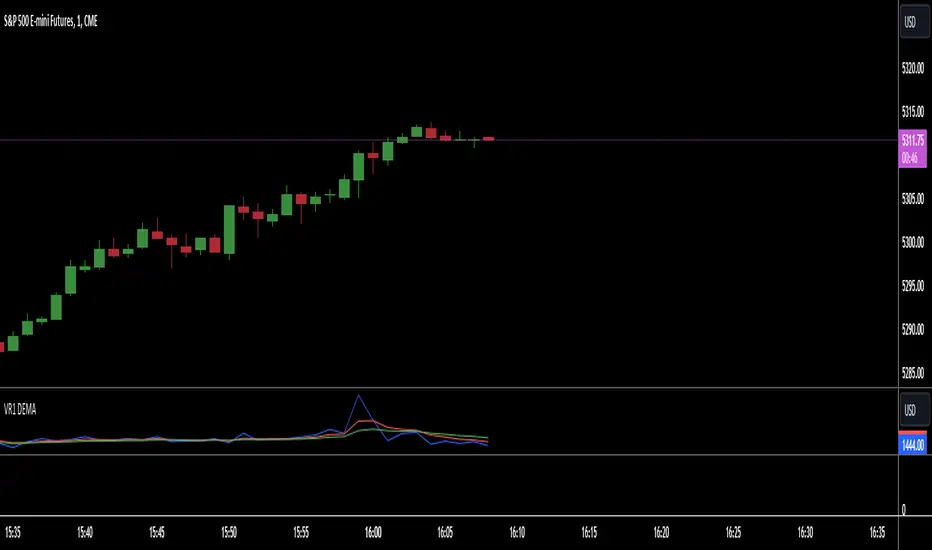
The "Volume Range Dual EMA" indicator is a technical analysis tool designed for TradingView charts. It calculates the ratio of volume to the price range of each bar and plots two Exponential Moving Averages (EMAs) of this ratio.
**Usage:**
- This indicator helps traders analyze the relationship between volume and price range in a given timeframe.
- The primary purpose of the indicator is to identify trends and potential changes in market sentiment based on volume and price movements.
- Traders can adjust the lengths of the EMAs according to their trading strategies and preferences.
- When the shorter EMA crosses above the longer EMA, it may signal a bullish trend, whereas a crossover in the opposite direction could indicate a bearish trend.
**Parameters:**
1. **EMA Length 1:** Defines the length of the first Exponential Moving Average (EMA) used in the calculation.
2. **EMA Length 2:** Defines the length of the second Exponential Moving Average (EMA) used in the calculation.
---
**Indicator Name:** Volume Range Dual EMA
**Description:**
The "Volume Range Dual EMA" indicator is a technical analysis tool designed for TradingView charts. It calculates the ratio of volume to the price range of each bar and plots two Exponential Moving Averages (EMAs) of this ratio.
**Usage:**
- This indicator helps traders analyze the relationship between volume and price range in a given timeframe.
- The primary purpose of the indicator is to identify trends and potential changes in market sentiment based on volume and price movements.
- Traders can adjust the lengths of the EMAs according to their trading strategies and preferences.
- When the shorter EMA crosses above the longer EMA, it may signal a bullish trend, whereas a crossover in the opposite direction could indicate a bearish trend.
**Parameters:**
1. **EMA Length 1:** Defines the length of the first Exponential Moving Average (EMA) used in the calculation.
2. **EMA Length 2:** Defines the length of the second Exponential Moving Average (EMA) used in the calculation.
Script protegido
Esse script é publicada como código fechado. No entanto, você pode usar ele livremente e sem nenhuma limitação – saiba mais aqui.
Aviso legal
As informações e publicações não devem ser e não constituem conselhos ou recomendações financeiras, de investimento, de negociação ou de qualquer outro tipo, fornecidas ou endossadas pela TradingView. Leia mais em Termos de uso.