OPEN-SOURCE SCRIPT
Atualizado US 20Y Treasury Yield
What This Indicator Does
This Pine Script creates a custom indicator for TradingView that displays the US 20-Year Treasury Yield (US20Y) on your chart. Here's what it does step by step:
1. What Is the US 20-Year Treasury Yield?
The US 20-Year Treasury Yield is a financial metric that shows the interest rate (or yield) investors earn when they buy US government bonds that mature in 20 years. It’s an important indicator of the economy and can influence other markets like stocks, bonds, and currencies.
2. How Does the Indicator Work?
The indicator fetches the latest data for the US 20-Year Treasury Yield from TradingView's database.
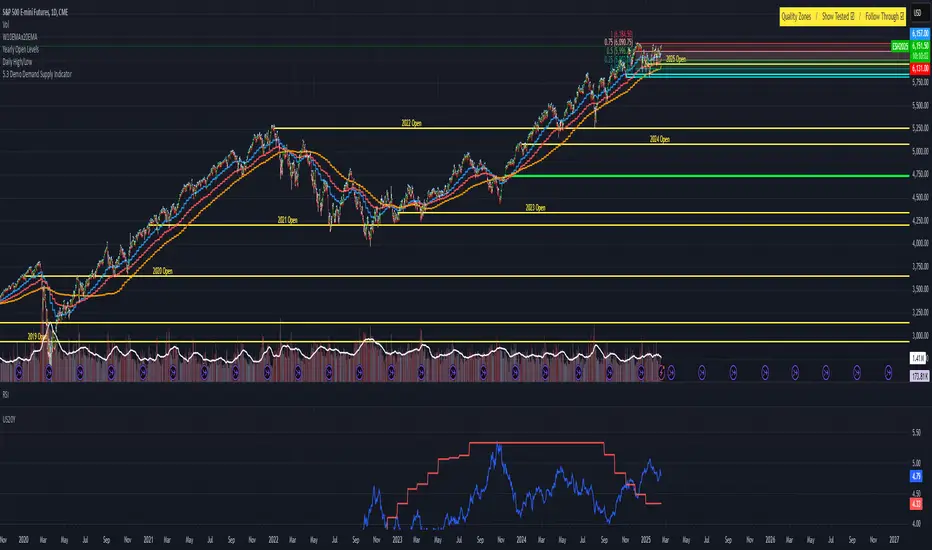
It then plots this data in a separate pane below your main chart, so you can easily monitor the yield without cluttering your price chart.
3. What Does the Indicator Show?
A blue line is drawn in the separate pane, showing the movement of the US 20-Year Treasury Yield over time.
A gray dashed line is added at the 4.0% level as a reference point. You can use this line to quickly see when the yield is above or below 4.0%.
5. Why Use This Indicator?
Monitor Economic Trends : The US 20-Year Treasury Yield is a key economic indicator. By plotting it on your chart, you can stay informed about changes in interest rates and their potential impact on other markets.
This Pine Script creates a custom indicator for TradingView that displays the US 20-Year Treasury Yield (US20Y) on your chart. Here's what it does step by step:
1. What Is the US 20-Year Treasury Yield?
The US 20-Year Treasury Yield is a financial metric that shows the interest rate (or yield) investors earn when they buy US government bonds that mature in 20 years. It’s an important indicator of the economy and can influence other markets like stocks, bonds, and currencies.
2. How Does the Indicator Work?
The indicator fetches the latest data for the US 20-Year Treasury Yield from TradingView's database.
It then plots this data in a separate pane below your main chart, so you can easily monitor the yield without cluttering your price chart.
3. What Does the Indicator Show?
A blue line is drawn in the separate pane, showing the movement of the US 20-Year Treasury Yield over time.
A gray dashed line is added at the 4.0% level as a reference point. You can use this line to quickly see when the yield is above or below 4.0%.
5. Why Use This Indicator?
Monitor Economic Trends : The US 20-Year Treasury Yield is a key economic indicator. By plotting it on your chart, you can stay informed about changes in interest rates and their potential impact on other markets.
Notas de Lançamento
1. What Is the US 20-Year Treasury Yield?The US 20-Year Treasury Yield is a financial metric that shows the interest rate (or yield) investors earn when they buy US government bonds that mature in 20 years. It’s an important indicator of the economy and can influence other markets like stocks, bonds, and currencies.
2. How Does the Indicator Work?
The indicator fetches the latest data for the US 20-Year Treasury Yield from TradingView's database.
It then plots this data in a separate pane below your main chart, so you can easily monitor the yield without cluttering your price chart.
3. What Does the Indicator Show?
A blue line is drawn in the separate pane, showing the movement of the US 20-Year Treasury Yield over time.
A gray dashed line is added at the 4.0% level as a reference point. You can use this line to quickly see when the yield is above or below 4.0%.
Script de código aberto
Em verdadeiro espírito do TradingView, o criador deste script o tornou de código aberto, para que os traders possam revisar e verificar sua funcionalidade. Parabéns ao autor! Embora você possa usá-lo gratuitamente, lembre-se de que a republicação do código está sujeita às nossas Regras da Casa.
Aviso legal
As informações e publicações não se destinam a ser, e não constituem, conselhos ou recomendações financeiras, de investimento, comerciais ou de outro tipo fornecidos ou endossados pela TradingView. Leia mais nos Termos de Uso.