OPEN-SOURCE SCRIPT
Simplified Hashrate Oscillator + Z-Score
Indicator Description for TradingView
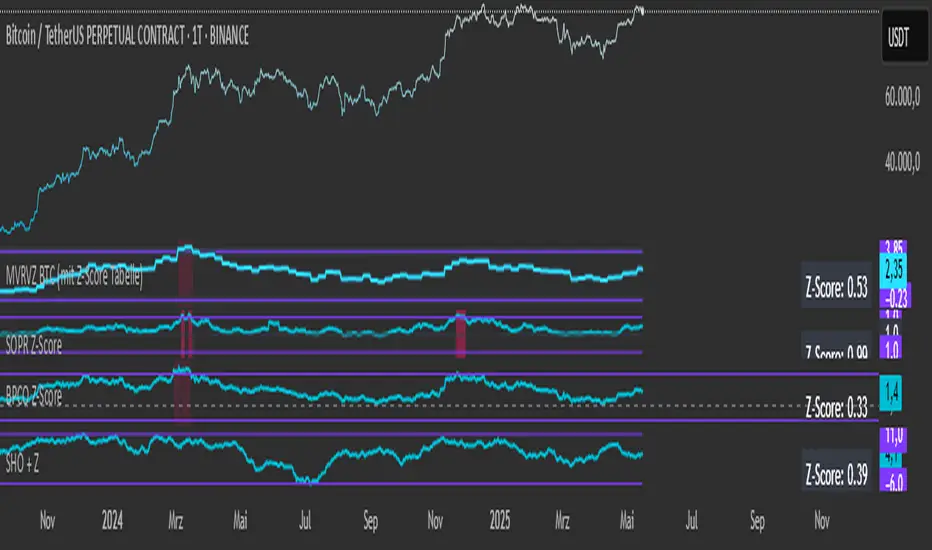
Simplified Hashrate Oscillator + Z-Score (SHO + Z)
This indicator analyzes the Bitcoin network's mining hashrate data by comparing short-term and long-term moving averages of the hashrate to create an oscillator that reflects changes in mining activity.
How it works:
The indicator calculates two Simple Moving Averages (SMAs) of the Bitcoin network hashrate — a short-term SMA (default 21 days) and a long-term SMA (default 105 days).
The difference between these two averages is normalized and expressed as a percentage, forming the Hashrate Oscillator line.
Two user-defined threshold lines (default ±7%) are plotted as upper and lower reference levels on the oscillator.
When the oscillator approaches these levels, it indicates potential extremes in mining activity.
Z-Score Explanation:
The Z-Score is a normalized measure that translates the oscillator's current value into a standardized scale roughly ranging from -2 to +2.
It shows how far the current hashrate oscillator value deviates from the user-defined thresholds.
A Z-Score near +2 means the oscillator is close to or above the upper threshold (possible overbought conditions).
A Z-Score near -2 means the oscillator is near or below the lower threshold (possible oversold conditions).
This helps users assess the relative strength or weakness of the mining hashrate movement in a normalized context.
Data Source:
The hashrate data is sourced daily from the Bitcoin network hashrate dataset provided by Quandl (QUANDL:BCHAIN/HRATE), a reliable blockchain data provider.
The indicator requests daily hashrate values and calculates SMAs accordingly.
How to use:
Watch the Hashrate Oscillator line for movements towards or beyond the threshold lines as signals of miner capitulation or recovery phases.
Use the Z-Score displayed in the table to quickly gauge how extreme the current reading is relative to set thresholds.
Adjust the short and long SMA periods and threshold lines to suit your preferred sensitivity and trading timeframe.
Script de código aberto
Em verdadeiro espírito do TradingView, o criador deste script o tornou de código aberto, para que os traders possam revisar e verificar sua funcionalidade. Parabéns ao autor! Embora você possa usá-lo gratuitamente, lembre-se de que a republicação do código está sujeita às nossas Regras da Casa.
Aviso legal
As informações e publicações não se destinam a ser, e não constituem, conselhos ou recomendações financeiras, de investimento, comerciais ou de outro tipo fornecidos ou endossados pela TradingView. Leia mais nos Termos de Uso.