OPEN-SOURCE SCRIPT
Dline
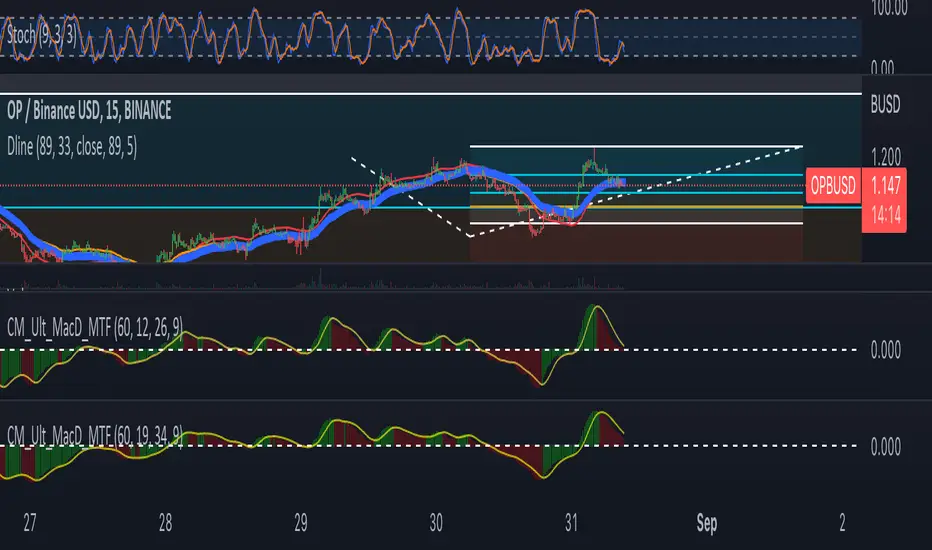
Dline is a indicator that was developed by B-Negative. This indicator was developed under convergence logic. If we have many information of prices, when the information was averaged with more enough, the average line will be the linear line that has direction. The direction of this linear line can help traders to analyze the direction of trends. Dline was made with TEMA, EMA, DEMA, and Dline line that is a average line between DEMA and EMA.
Under B-Negative's concept, DEMA and EMA that are average lines will convergence and have same direction when the trends are coming. Amount of data must more enough and diferrect by assets' type. However, user can change value of DEMA, Dline, EMA, and TEMA by themself under 7 concepts below.
1. EMA will convergence to close Dline when the trend will be changing.
2. The uptrend will occure when EMA above/below Dline and candle sticks are green/red color.
3. TEMA was setted similair DEMA.
4. When new high/low of wave cross TEMA and can not retrun to create higher/lower high/low (At oversold/overbought, Stocastic 9,3,3 counting with loop technique), that is exit point of position.
5. Difference of timeframe or assets could use different parameters. (Setting based on 4 rule above.)
6. Divergence between Dline and EMA mean sentiment of assets are sideways.
7. If Dline and EMA look like same line, the trend is most strength trend.
Dline use thickness = 4
EMA use thickness = 1
This ex. is timeframe day.
Script de código aberto
Em verdadeiro espírito do TradingView, o criador deste script o tornou de código aberto, para que os traders possam revisar e verificar sua funcionalidade. Parabéns ao autor! Embora você possa usá-lo gratuitamente, lembre-se de que a republicação do código está sujeita às nossas Regras da Casa.
Aviso legal
As informações e publicações não se destinam a ser, e não constituem, conselhos ou recomendações financeiras, de investimento, comerciais ou de outro tipo fornecidos ou endossados pela TradingView. Leia mais nos Termos de Uso.