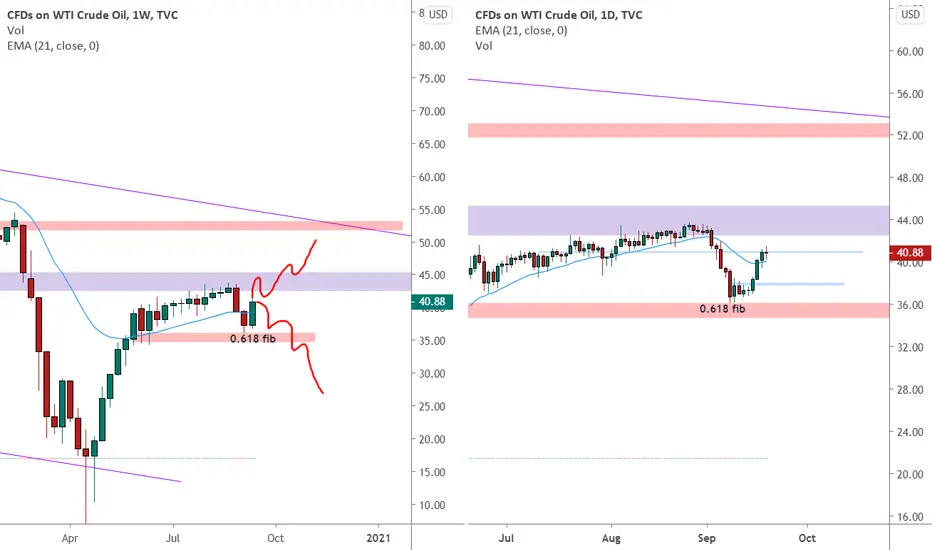
Oil on the Weekly chart hit the strong resistance near to a monthly level and start a retracement back.
The market after hit the lower weekly structure at the 0.618 fib level retracement and couldn’t manage to break below.
Price bounce over it and create a weekly double bottom higher close.
In the lower right chart (daily) we can see that price is now near to a minor daily resistance.
We will consider to open a position only at the break of the key level as shown on the chart.
–––––
Follow the Shrimp 🦐
Here is the Plancton0618 technical analysis , please comment below if you have any question.
The ENTRY in the market will be taken only if the condition of Plancton0618 strategy will trigger
Aviso legal
As informações e publicações não se destinam a ser, e não constituem, conselhos ou recomendações financeiras, de investimento, comerciais ou de outro tipo fornecidos ou endossados pela TradingView. Leia mais nos Termos de Uso.
Aviso legal
As informações e publicações não se destinam a ser, e não constituem, conselhos ou recomendações financeiras, de investimento, comerciais ou de outro tipo fornecidos ou endossados pela TradingView. Leia mais nos Termos de Uso.