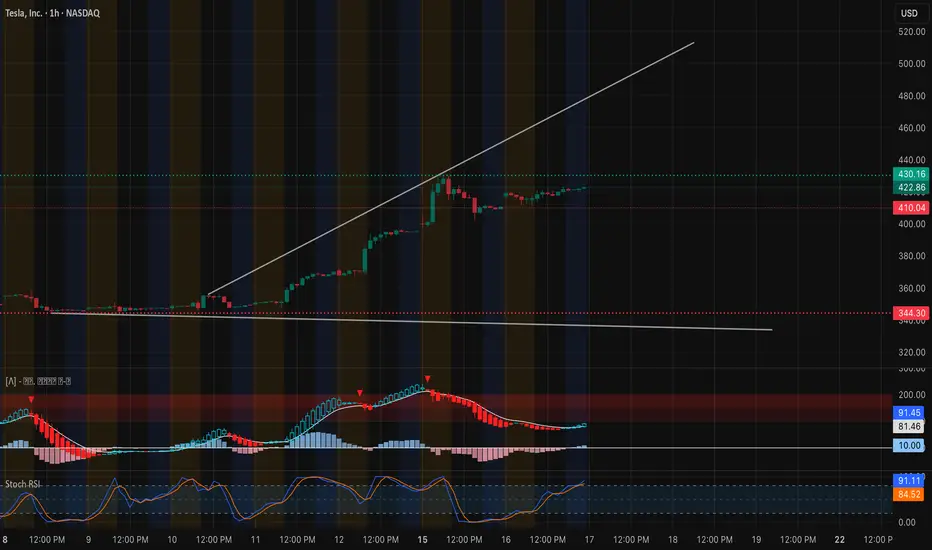
1-Hour Chart Technical View
Tesla’s rally from sub-$350 to the $420 area is now consolidating. After an explosive breakout on Sept 12–13, the 1-hour candles are moving sideways in a tight $410–$430 box. MACD has cooled from overbought and is starting to curl back up, while Stoch RSI is hovering in a neutral zone—showing that momentum is recharging, not reversing.
* Immediate Support: $410 (critical breakout retest)
* Major Support: $344 (key demand and high-volume node)
* Near-Term Resistance: $430–$440 (current supply zone)
* Upside Magnet: $450 and $484 if $440 clears with volume
EMA alignment (9 above 21) still favors the bulls, and price continues to respect the uptrend line from the early September pivot.
GEX & Options Flow

Options data underline strong bullish hedging pressure:
* Call Walls: $430 (2nd call wall), $440 (highest positive NET GEX / gamma resistance), $450 next target.
* Put Walls: $407.5 (1st defense), then $385 and $322.5.
* GEX Bias: Calls dominate with 92.8% call-weighted exposure. IVR at 20.1 (IVx ~65.9)
suggests decent option premiums but not extreme volatility pricing.
This configuration typically supports dip buying and favors upward grind, provided $410 stays intact.
Trade Thoughts & Suggestions
* Swing Idea: Accumulation on 1-hour closes above $410 with a stop below $400, aiming for $440–$450, and possibly $484 on continuation.
* Scalp Idea: Intraday traders can fade extremes inside the $410–$430 range, or take a momentum scalp if $430 breaks on strong volume.
* Bearish Scenario: A decisive break under $400 could unwind gamma support and invite a test of $385 and $344.
Quick Take
TSLA is digesting sharp gains in a healthy range. Strong call gamma at $430–$440 is both a near-term lid and a potential springboard. For Sept 17, look for continuation plays if $430 is taken out with conviction.
Disclaimer: This analysis is for educational purposes only and does not constitute financial advice. Always do your own research and manage risk before trading.
Tesla’s rally from sub-$350 to the $420 area is now consolidating. After an explosive breakout on Sept 12–13, the 1-hour candles are moving sideways in a tight $410–$430 box. MACD has cooled from overbought and is starting to curl back up, while Stoch RSI is hovering in a neutral zone—showing that momentum is recharging, not reversing.
* Immediate Support: $410 (critical breakout retest)
* Major Support: $344 (key demand and high-volume node)
* Near-Term Resistance: $430–$440 (current supply zone)
* Upside Magnet: $450 and $484 if $440 clears with volume
EMA alignment (9 above 21) still favors the bulls, and price continues to respect the uptrend line from the early September pivot.
GEX & Options Flow
Options data underline strong bullish hedging pressure:
* Call Walls: $430 (2nd call wall), $440 (highest positive NET GEX / gamma resistance), $450 next target.
* Put Walls: $407.5 (1st defense), then $385 and $322.5.
* GEX Bias: Calls dominate with 92.8% call-weighted exposure. IVR at 20.1 (IVx ~65.9)
suggests decent option premiums but not extreme volatility pricing.
This configuration typically supports dip buying and favors upward grind, provided $410 stays intact.
Trade Thoughts & Suggestions
* Swing Idea: Accumulation on 1-hour closes above $410 with a stop below $400, aiming for $440–$450, and possibly $484 on continuation.
* Scalp Idea: Intraday traders can fade extremes inside the $410–$430 range, or take a momentum scalp if $430 breaks on strong volume.
* Bearish Scenario: A decisive break under $400 could unwind gamma support and invite a test of $385 and $344.
Quick Take
TSLA is digesting sharp gains in a healthy range. Strong call gamma at $430–$440 is both a near-term lid and a potential springboard. For Sept 17, look for continuation plays if $430 is taken out with conviction.
Disclaimer: This analysis is for educational purposes only and does not constitute financial advice. Always do your own research and manage risk before trading.
Aviso legal
As informações e publicações não devem ser e não constituem conselhos ou recomendações financeiras, de investimento, de negociação ou de qualquer outro tipo, fornecidas ou endossadas pela TradingView. Leia mais em Termos de uso.
Aviso legal
As informações e publicações não devem ser e não constituem conselhos ou recomendações financeiras, de investimento, de negociação ou de qualquer outro tipo, fornecidas ou endossadas pela TradingView. Leia mais em Termos de uso.