Tube Investments of India Ltd (TIINDIA) has been a notable player in the Indian engineering sector, with a diversified portfolio spanning automotive components, bicycles, metal-formed products, and precision steel tubes. As of April 2025, the stock has experienced significant volatility, prompting investors to closely examine its fundamentals and technical outlook.
📊 Fundamental Overview
Valuation Metrics:
Financial Performance:
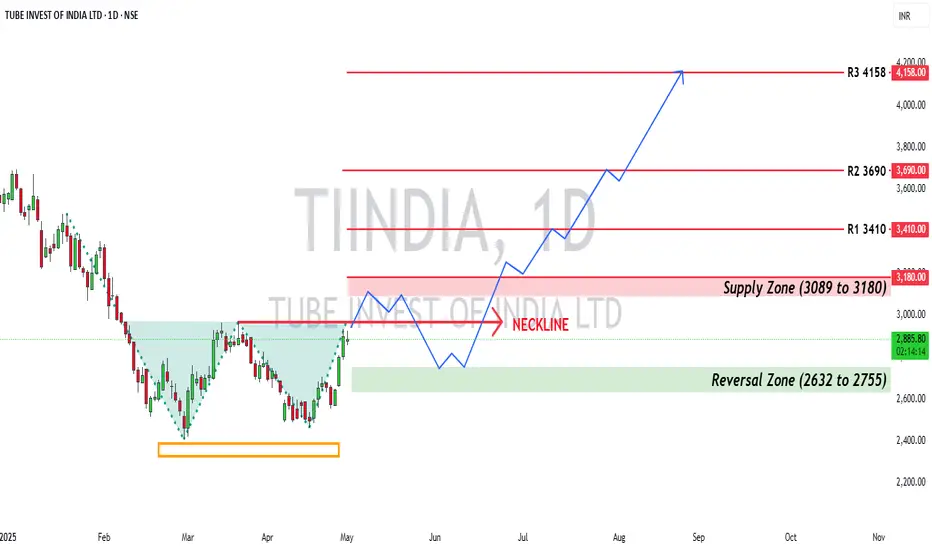
Tube Investments of India Ltd (NSE: TIINDIA) is exhibiting a classic double bottom pattern on the daily chart, signaling potential reversal strength. While fundamentals reflect a strong industrial play with high valuation multiples, the technical setup suggests a critical moment for traders to watch.
📉 Technical Analysis (Daily Timeframe)
Pattern: Double Bottom
Neckline Breakout Zone: ~₹2,967.50
🟨 Immediate Supply Zone: ₹3,089 – ₹3,180
🟩 Support Zone (Bottom Reversal Area): ₹2,632 – ₹2,755
🔺 Major Resistance Levels (Above Breakout):
📌 Conclusion
TIINDIA is at a make-or-break juncture on the charts. A decisive breakout above ₹3,180 could drive strong upside momentum toward ₹3,410 and beyond. However, traders should watch for a rejection near the supply zone and possible retest of the lower support band before a confirmed move.
📊 Fundamental Overview
Valuation Metrics:
- Price-to-Earnings (P/E) Ratio: Approximately 61.5, indicating a premium valuation compared to industry peers.
- Price-to-Book (P/B) Ratio: Around 9.4, suggesting the stock is trading at a high multiple of its book value.
- Earnings Per Share (EPS): ₹42.43, reflecting the company's profitability.
Financial Performance:
- Revenue (TTM): ₹182.5 billion.
- Net Income (TTM): ₹8.13 billion.
- Gross Margin: 31.38%.
- Net Profit Margin: 4.45%.
Tube Investments of India Ltd (NSE: TIINDIA) is exhibiting a classic double bottom pattern on the daily chart, signaling potential reversal strength. While fundamentals reflect a strong industrial play with high valuation multiples, the technical setup suggests a critical moment for traders to watch.
📉 Technical Analysis (Daily Timeframe)
Pattern: Double Bottom
Neckline Breakout Zone: ~₹2,967.50
- Current Structure: The stock has formed a double bottom and is now consolidating near the neckline, awaiting a decisive breakout.
🟨 Immediate Supply Zone: ₹3,089 – ₹3,180
- This zone is expected to act as a resistance barrier.
- A rejection from here is possible on the first test, especially if volume doesn’t confirm the breakout.
🟩 Support Zone (Bottom Reversal Area): ₹2,632 – ₹2,755
- If rejection occurs at the supply zone, this region may provide buy-on-dip opportunities.
- Historically respected as a strong demand zone.
🔺 Major Resistance Levels (Above Breakout):
- ₹3,410 (first major breakout target)
- ₹3,690 (medium-term resistance)
- ₹4,158 (long-term breakout target)
📌 Conclusion
TIINDIA is at a make-or-break juncture on the charts. A decisive breakout above ₹3,180 could drive strong upside momentum toward ₹3,410 and beyond. However, traders should watch for a rejection near the supply zone and possible retest of the lower support band before a confirmed move.
Aviso legal
As informações e publicações não se destinam a ser, e não constituem, conselhos ou recomendações financeiras, de investimento, comerciais ou de outro tipo fornecidos ou endossados pela TradingView. Leia mais nos Termos de Uso.
Aviso legal
As informações e publicações não se destinam a ser, e não constituem, conselhos ou recomendações financeiras, de investimento, comerciais ou de outro tipo fornecidos ou endossados pela TradingView. Leia mais nos Termos de Uso.