Technical Analysis and Outlook:
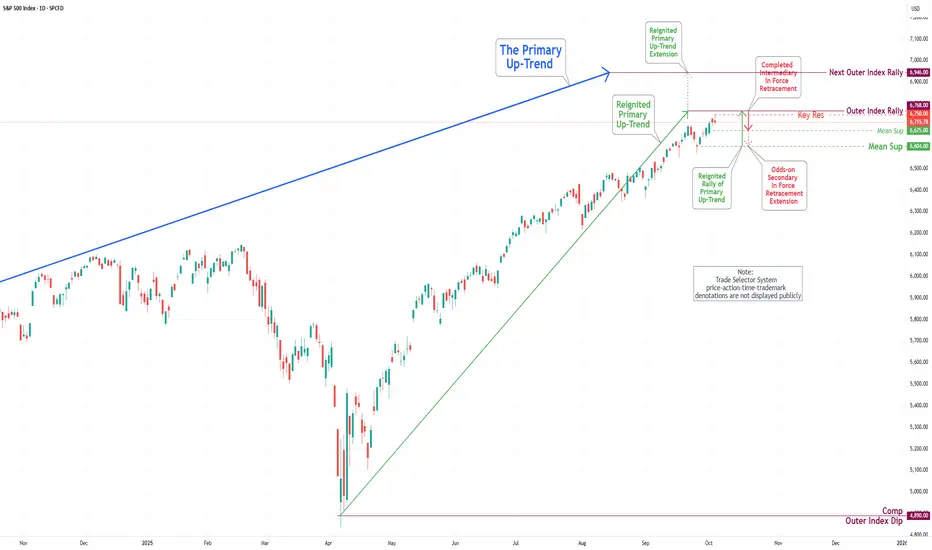
In the previous week’s trading session, the S&P 500 Index demonstrated a significant increase in upward price activity, rebounding from the Mean Support level of 6585. The index not only retested but also exceeded our primary target set at Key Resistance of 6693 and the Inner Index Rally level of 6704.
At present, the index is situated just below the newly established Key Resistance level of 6750, and it appears to be on track to complete the Outer Index Rally at 6768, indicating the potential for further upward momentum in the near future that could extend to the subsequent Outer Index Rally target of 6946.
It is essential to recognize that upon achieving the Key Resistance target of 6750 and the Outer Index Rally target of 6768, there may be an ensuing pullback toward the Mean Support level of 6675. Furthermore, there is a possibility of a further decline that could extend to the Mean Support target of 6604.
Publicações relacionadas
Aviso legal
The information and publications are not meant to be, and do not constitute, financial, investment, trading, or other types of advice or recommendations supplied or endorsed by TradingView. Read more in the Terms of Use.
Publicações relacionadas
Aviso legal
The information and publications are not meant to be, and do not constitute, financial, investment, trading, or other types of advice or recommendations supplied or endorsed by TradingView. Read more in the Terms of Use.