Detailed Market Structure Breakdown
4-Hour Chart (Macro Trend)
Structure: The Sensex is now in a Corrective Phase, having broken the lower trendline of the aggressive ascending channel and closing below the critical 83,600 support. The price is trending lower within a descending channel.
Key Levels:
Major Supply (Resistance): 84,200 - 84,400. This area (the breakdown level and previous FVG) is the key overhead resistance. A "Sell on Rise" strategy is favored in this zone.
Major Demand (Support): 82,900 - 83,200. This is the most critical support zone, aligning with the lowest point of the previous correction and a major FVG (Fair Value Gap).
Outlook: The short-term bias is Bearish. A breakdown below 83,300 would trigger a deeper correction towards 82,900.
1-Hour Chart (Intermediate View)
Structure: The 1H chart is strongly bearish, trading in a well-defined descending channel, confirming the short-term correction. The market is making lower lows and lower highs, and the price closed near the channel's lower boundary.
Key Levels:
Immediate Resistance: 83,600 (Upper boundary of the descending channel).
Immediate Support: 83,200 (Lower boundary of the descending channel).
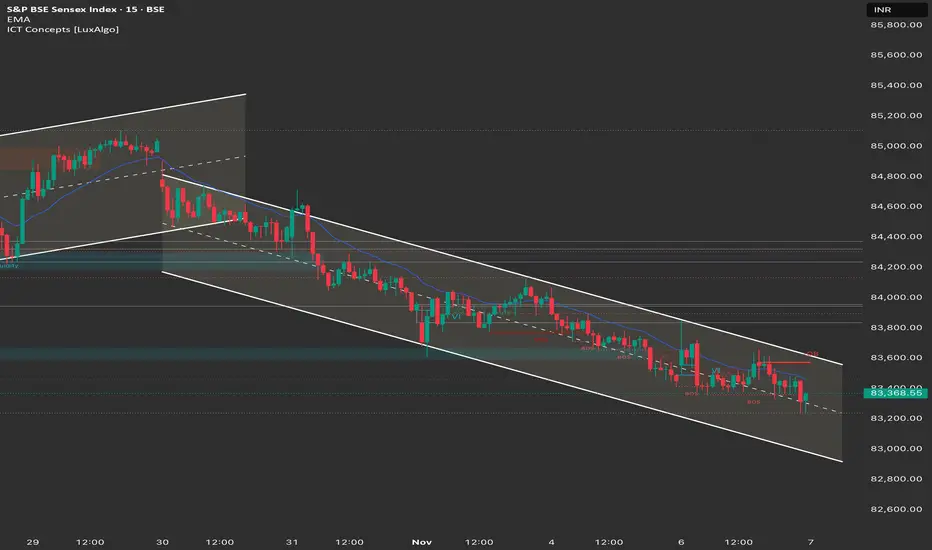
15-Minute Chart (Intraday View)
Structure: The 15M chart confirms the steep descending channel and strong intraday bearish control. The market is making lower highs and lower lows, closing with a small bearish candle.
Key Levels:
Intraday Supply: 83,600.
Intraday Demand: 83,200.
Outlook: Strongly Bearish.
📈 Structure Analysis & Trade Plan: 7th November
Market Outlook: The Sensex is in a strong bearish trend, with the structure favoring continuation towards major support at 83,200. The overall strategy is Sell on Rise or Breakdown.
Bearish Scenario (Primary Plan: Correction Continuation/Sell on Rise)
Justification: The breakdown below 83,600 and the confirmed descending channel favor continuation toward the macro support.
Entry: Short entry on a successful retest and rejection of the 83,600 - 83,800 level (upper channel resistance/FVG) OR Short on a decisive break and 15-minute candle close below 83,200.
Stop Loss (SL): Place a stop loss above 84,000 (above the immediate swing high).
Targets:
T1: 83,200 (Lower channel support/Major FVG).
T2: 82,900 (Next major demand zone).
Bullish Scenario (Counter-Trend/Reversal)
Justification: A short-covering bounce is possible if the market aggressively reclaims the channel.
Trigger: A sustained move and close above 84,000.
Entry: Long entry on a confirmed 15-minute close above 84,000.
Stop Loss (SL): Below 83,600.
Targets:
T1: 84,200 (Major overhead resistance).
T2: 84,400 (Previous swing high).
Key Levels for Observation:
Immediate Decision Point: 83,200 - 83,600 zone.
Bearish Confirmation: Sustained trade below 83,200.
Bullish Confirmation: A move back above 84,000.
Line in the Sand: 83,600. Below this, the trend is strongly bearish.
4-Hour Chart (Macro Trend)
Structure: The Sensex is now in a Corrective Phase, having broken the lower trendline of the aggressive ascending channel and closing below the critical 83,600 support. The price is trending lower within a descending channel.
Key Levels:
Major Supply (Resistance): 84,200 - 84,400. This area (the breakdown level and previous FVG) is the key overhead resistance. A "Sell on Rise" strategy is favored in this zone.
Major Demand (Support): 82,900 - 83,200. This is the most critical support zone, aligning with the lowest point of the previous correction and a major FVG (Fair Value Gap).
Outlook: The short-term bias is Bearish. A breakdown below 83,300 would trigger a deeper correction towards 82,900.
1-Hour Chart (Intermediate View)
Structure: The 1H chart is strongly bearish, trading in a well-defined descending channel, confirming the short-term correction. The market is making lower lows and lower highs, and the price closed near the channel's lower boundary.
Key Levels:
Immediate Resistance: 83,600 (Upper boundary of the descending channel).
Immediate Support: 83,200 (Lower boundary of the descending channel).
15-Minute Chart (Intraday View)
Structure: The 15M chart confirms the steep descending channel and strong intraday bearish control. The market is making lower highs and lower lows, closing with a small bearish candle.
Key Levels:
Intraday Supply: 83,600.
Intraday Demand: 83,200.
Outlook: Strongly Bearish.
📈 Structure Analysis & Trade Plan: 7th November
Market Outlook: The Sensex is in a strong bearish trend, with the structure favoring continuation towards major support at 83,200. The overall strategy is Sell on Rise or Breakdown.
Bearish Scenario (Primary Plan: Correction Continuation/Sell on Rise)
Justification: The breakdown below 83,600 and the confirmed descending channel favor continuation toward the macro support.
Entry: Short entry on a successful retest and rejection of the 83,600 - 83,800 level (upper channel resistance/FVG) OR Short on a decisive break and 15-minute candle close below 83,200.
Stop Loss (SL): Place a stop loss above 84,000 (above the immediate swing high).
Targets:
T1: 83,200 (Lower channel support/Major FVG).
T2: 82,900 (Next major demand zone).
Bullish Scenario (Counter-Trend/Reversal)
Justification: A short-covering bounce is possible if the market aggressively reclaims the channel.
Trigger: A sustained move and close above 84,000.
Entry: Long entry on a confirmed 15-minute close above 84,000.
Stop Loss (SL): Below 83,600.
Targets:
T1: 84,200 (Major overhead resistance).
T2: 84,400 (Previous swing high).
Key Levels for Observation:
Immediate Decision Point: 83,200 - 83,600 zone.
Bearish Confirmation: Sustained trade below 83,200.
Bullish Confirmation: A move back above 84,000.
Line in the Sand: 83,600. Below this, the trend is strongly bearish.
Aviso legal
As informações e publicações não se destinam a ser, e não constituem, conselhos ou recomendações financeiras, de investimento, comerciais ou de outro tipo fornecidos ou endossados pela TradingView. Leia mais nos Termos de Uso.
Aviso legal
As informações e publicações não se destinam a ser, e não constituem, conselhos ou recomendações financeiras, de investimento, comerciais ou de outro tipo fornecidos ou endossados pela TradingView. Leia mais nos Termos de Uso.