Topic Statement:
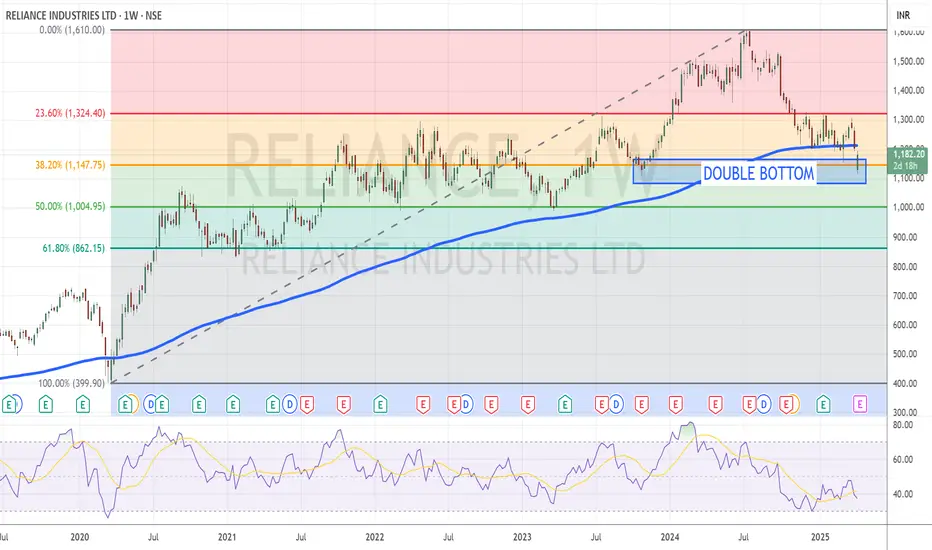
Reliance has undergone a healthy correction in line with the broader market and is showing signs of a potential reversal from key support levels.
Key Points:
- The stock is taking strong support at the 38.2% Fibonacci retracement level near ₹1147.
- Candlestick pattern indicates the formation of a potential double bottom.
- Price is trading below the 180-day EMA, suggesting an oversold condition.
- Weekly RSI stands at 37.5, further confirming the stock is in an oversold zone.
Aviso legal
As informações e publicações não devem ser e não constituem conselhos ou recomendações financeiras, de investimento, de negociação ou de qualquer outro tipo, fornecidas ou endossadas pela TradingView. Leia mais em Termos de uso.
Aviso legal
As informações e publicações não devem ser e não constituem conselhos ou recomendações financeiras, de investimento, de negociação ou de qualquer outro tipo, fornecidas ou endossadas pela TradingView. Leia mais em Termos de uso.