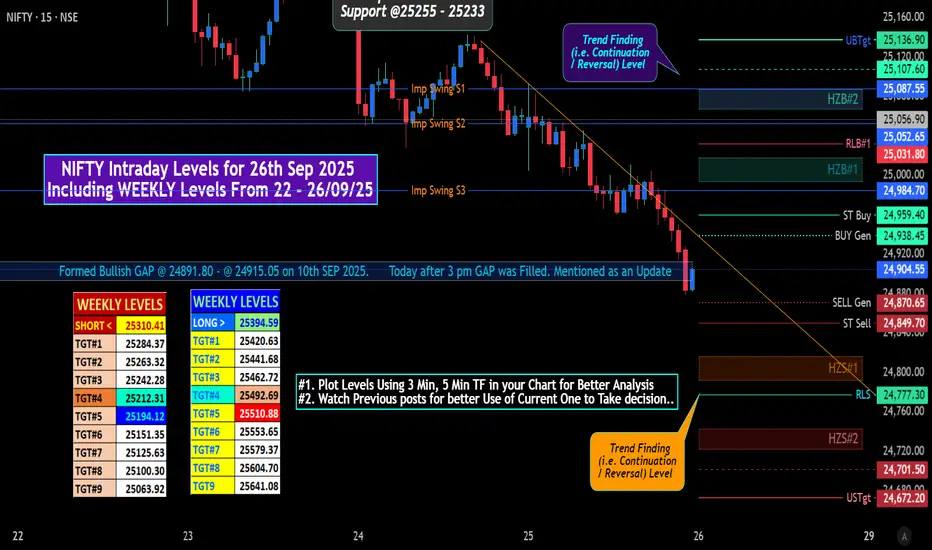
NIFTY Intraday Levels for 26th Sep 2025
NIFTY — 1-hour technical read
Short version — Structure & Bias
• The 1-hour structure has flipped from a clean rally (early Sep → 17–18 Sep peak) into a short-term downtrend (mentioned on 19th Sep 2025 POST): lower highs after the mid-Sep peak and a sharp sequence of bearish candles the past few sessions.
• Price is sitting at ~24,904.55 (blue line on the chart). That area is an important near-term pivot: holding it likely produces a short bounce / range; losing it opens the way to the next support zone.
Market structure (what I see)
• Uptrend → distribution → Down move. From Sep 3 → Sep 17 saw Higher Highs /Higher Lows. After topping ~25,48.95 there was a distribution phase and sellers pushed price lower.
• Recent price action: Steady series of red hourly candles with only small corrective candles — momentum favors bears on the 1-hour.
• Shorter horizon: immediate reaction (last candle) shows a small blue candle near the dotted line — indicates a short pause, not yet a reversal.
### For more Details do comment.
GIFTNIFTY TRADING fLAT TO -vE.
# "WEEKLY Levels" mentioned in BOX format.
^^^^^^^Plot Levels Using 3 Min, 5 Min Time frame in your Chart for Better Analysis^^^^^^^
L#1: If the candle crossed & stays above the “Buy Gen”, it is treated / considered as Bullish bias.
L#2: Possibility / Probability of REVERSAL near RLB#1 & UBTgt
L#3: If the candle stays above “Sell Gen” but below “Buy Gen”, it is treated / considered as Sidewise. Aggressive Traders can take Long position near “Sell Gen” either retesting or crossed from Below & vice-versa i.e. can take Short position near “Buy Gen” either retesting or crossed downward from Above.
L#4: If the candle crossed & stays below the “Sell Gen”, it is treated / considered a Bearish bias.
L#5: Possibility / Probability of REVERSAL near RLS#1 & USTgt
HZB (Buy side) & HZS (Sell side) => Hurdle Zone,
*** Specialty of “HZB#1, HZB#2 HZS#1 & HZS#2” is Sidewise (behaviour in Nature)
Rest Plotted and Mentioned on Chart
Color code Used:
Green =. Positive bias.
Red =. Negative bias.
RED in Between Green means Trend Finder / Momentum Change
/ CYCLE Change and Vice Versa.
Notice One thing: HOW LEVELS are Working.
Use any Momentum Indicator / Oscillatoror as you "USED to" to Take entry.
📊 Disclaimer
I am not a SEBI-registered financial adviser.
The information, views, and ideas shared here are purely for educational and informational purposes only. They are not intended as investment advice or a recommendation to buy, sell, or hold any financial instruments.
Trading and investing in the stock market involves risk, and you should do your own research and analysis. You are solely responsible for any decisions made based on this research.
"As HARD EARNED MONEY IS YOUR's, So DECISION SHOULD HAVE TO BE YOUR's".
Nota
For Tomorrow's trade 24940 plays a Crucial Role. If Crossed and Sustain above for 15 - 30mins PULLBack may possible.Though as of now GIFTNIFTY Traded "FLAT to -VE" Pause situation after Continuios 4 Day fall.
Publicações relacionadas
Aviso legal
As informações e publicações não devem ser e não constituem conselhos ou recomendações financeiras, de investimento, de negociação ou de qualquer outro tipo, fornecidas ou endossadas pela TradingView. Leia mais em Termos de uso.
Publicações relacionadas
Aviso legal
As informações e publicações não devem ser e não constituem conselhos ou recomendações financeiras, de investimento, de negociação ou de qualquer outro tipo, fornecidas ou endossadas pela TradingView. Leia mais em Termos de uso.